Building a Fully Automated Paid Media Reporting Pipeline with FiveTran
Successful paid media campaigns are only as good as the reporting that supports them. The more often data is used to inform decision making, the better those decisions become.
That makes reporting automation essential. Without it, reporting is a process that takes significant time pulling data, compiling it into a useable format, and visualizing results.
Automation streamlines this process, shifting effort away from manual data collection and toward strategic analysis.
Many teams treat reporting as an output. In reality, it is infrastructure.
Good infrastructure facilitates better decision speed, cross-channel comparability, and signal density. Bad infrastructure only works to slow the entire process down.
This article breaks down how Fivetran, a leading data integration platform, can be used to automate paid media reporting, and where it fits into the larger measurement system.
Skip straight to the setup guide
What You’ll Learn
- How to structure Google, Meta, and TikTok reporting data in Fivetran
- How to standardize conversions and revenue across platforms
- How to design a master reporting layer for cross-channel performance
- How to avoid double counting and attribution discrepancies
- How to build a scalable paid media reporting architecture
The Architecture Overview
The data pipeline from ad platform to visualization tool is relatively simple. Fivetran acts as the connector between ad platform and data warehouse, and a visualization tool uses data in the data warehouse to transform metrics into insights.
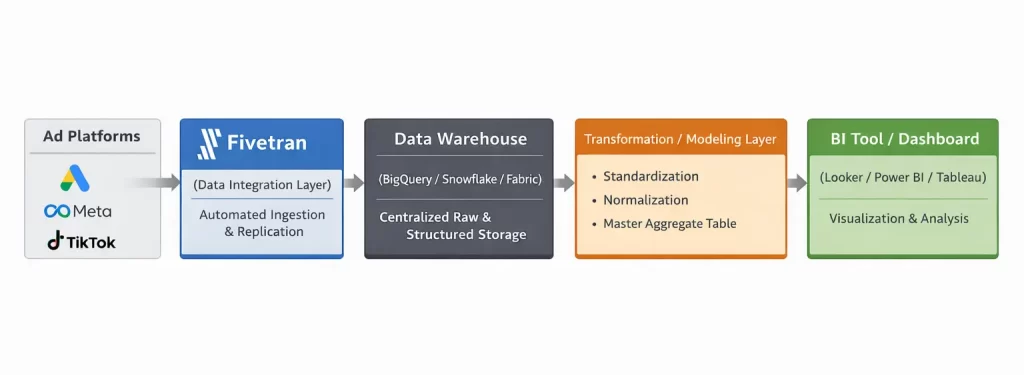
Everything that happens in between however, is a little more complicated.
The Differentiated Value of a Data Warehouse
Before we get into specifics, it’s important to understand the value of a data warehouse. Platforms like BigQuery, Snowflake, or in this case, Microsoft Fabric, act as repositories that store data from various channels.
Think of it like master platform that controls data from across an organization – paid media, offline, website, 3rd-party platforms – all in one place.
This centralized repository makes reporting significantly easier because instead of pulling individual reports, data automatically imports and organizes itself into a useable format.
That means as campaigns grow and spend scales, performance tracking comes along with it, supporting advanced analysis like incrementality testing and media mix modeling.
The Crucial Piece of Setup: Standardization
To get there, data must be standardized. This is the part of the process that takes the most work because different data sources use different naming conventions, have slightly different metric definitions, and generally are not initially compatible.
As a marketer, understanding what metrics are needed to import and how they will be used is of utmost importance.
Let’s take a look at how reports can be set up from three of the most popular ad platforms: Google, Meta, and TikTok.
Before beginning, it’s important to review Fivetran’s report schemas. These can be found for each platform in their list of connectors.
Google Ads Fivetran Connector Setup
Start by connecting Google Ads inside Fivetran using your Google account. Log in with the Google account that has access to the ad accounts you want to sync.
This will populate all ad accounts that are accessible through the login. Choose the account(s) you want to replicate into your warehouse.
Sync Settings
For most reporting use cases:
- Sync at log level
- Refresh daily
Daily sync is more than enough for most reporting. Hourly increases cost and warehouse load, so don’t use it unless absolutely necessary.
For advanced analysis like MMM, import at least 24 months of historical data to build a more accurate model.
Pre-Built Report Setup
Fivetran provides pre-built Google Ads tables that cover most operational needs.
For most advertisers, start with Campaign Hourly Stats. This includes:
- Cost
- Impressions
- Clicks
- Conversions
- Conversion value
For additional granularity, also include:
- Ad Group Hourly Stats
- Keyword Stats
These are available as separate tables, but can be joined further downstream. For 80% of reporting needs, these tables are sufficient.
Custom Report Setup
For breakdowns of specific conversion actions or custom segments, you’ll need to build a custom report using Google Ads Query Language (GAQL).
GAQL works just like SQL. It’s simplified into three core concepts:
- Resource (FROM clause) – what you’re reporting on (e.g., campaigns)
- Metrics (metrics.*) – performance values
- Segments (segments.*) – breakdown dimensions
The GAQL will ultimately include fields like:
- campaign.id
- campaign.name
- segments.date
- segments.conversion_action_name
- metrics.all_conversions
- metrics.all_conversions_value
This structure provides conversion date broken out by Date, Campaign, and Conversion Action
Joining Custom Data to Pre-Built Tables
The key piece of technical work to make custom data usable is standardization with your pre-built table.
Join custom data and pre-built metrics using:
- date
- campaign_id
These will create columns for each of your metrics including all conversion actions queried.
This allows for better analysis of what campaigns are driving real-world action and revenue.
Meta Ads Fivetran Connector Setup
The Meta Ads connector works similarly to Google Ads. Connect your ad account using your Facebook login credentials and select the ad account to import.
Sync Settings
Again, sync the account using:
- Sync daily
- Pull reporting data at the campaign/ad set/ad level
Unlike Google Ads, Meta does not expose true log-level click data via the Ads Insights API. Reporting is aggregated by entity and date.
Daily syncing will give you the flexibility necessary to report on weekly trends (which is as granular as you should be looking).
Pre-built Report Setup
Fivetran also provides pre-built reports for Meta Ads that contain most metrics needed to report on campaign performance.
The best place to start is with the Basic All Levels report. It includes:
- Spend
- Impressions
- Clicks
- Actions (conversions)
- Day
- Campaign
- Ad Set
- Ad
Unlike Google Ads, conversions (actions) are not limited to the campaign’s optimization event. If an ad is optimized for purchases, but also drives leads, both will appear in actions.
To analyze specific events, create a derived table that breaks out action_type
Custom Conversion Reporting
In your data warehouse, create a separate table using the Basic All Stats report that unnests actions into rows.
The table will include:
- Day
- Campaign (or Ad Set or Ad, depending on reporting granularity)
- Action Type
- Actions (conversion count)
Standard events (e.g. purchase, lead) and custom conversions both appear as action_type values.
Using basic SQL select the events to track and sum against your day/campaign.
Aggregating the Data
To combine data from both tables, join on:
- Date
- Campaign Name
Basic All Levels report pulls delivery metrics and your derived action_type table maps events to new columns.
TikTok Ads Fivetran Connector Setup
TikTok’s connector is structurally more similar to Meta than Google Ads, though there are important differences in how reporting tables are organized.
Sync Settings
Use your TikTok Ads login credentials to grant Fivetran access to the account. Sync data using:
- Daily sync
- Campaign/Ad Set/Ad level reporting
TikTok also doesn’t provide click-level log data. Reporting is aggregated by entity (campaign, ad group, ad) and date. A daily sync is sufficient for trend and performance analysis.
Pre-Built Report Setup
TikTok’s reporting tables are split by level. Instead of a single “all levels” report, Fivetran syncs separate reporting tables for:
- Campaign reporting
- Ad group reporting
- Ad reporting
Each uses their full list of core metrics, but granularity depends on the analysis needed.
From their list of available reports, you can easily gather the metrics included. Most core performance metrics live under:
Auction Ads Basic Data
This includes:
- Impressions
- Clicks
- Spend
Video engagements are grouped separately under:
Video Play Data
This includes metrics such as video views, watch time, and completion rates. Given TikTok’s view-heavy platform, these metrics are very important for analysis of TikTok performance.
Understanding Conversions in TikTok
TikTok differs from Meta in how conversions are stored.
While TikTok provides a roll-up conversion metric, it also exposes each event as its own distinct metric column (e.g., purchase, add_to_cart, complete_payment).
That means you don’t need to create a derived table like you do in Meta.
Instead, each event is tracked as it’s own metric based on how events are configured in TikTok Ads.
If revenue tracking is implemented correctly, a corresponding value metric (e.g., purchase_value) is also provided.
Aggregating the Data
Unlike Google and Meta, there is no need to aggregate data because conversion metrics already live directly within each reporting table.
However, Campaign, Ad Group, and Ad reports should not be combined.
They contain the same metrics summarized at different levels of aggregation, and will almost always introduce double-counting.
Instead:
- Select one reporting level based on your analysis needs.
- Work out of that table as your source of truth.
To recap, platform schema across the three channels shows some similarities and differences.
| Platform | Conversion Storage | Revenue Storage | Reporting Structure |
|---|---|---|---|
| Metric columns | Metric columns | Entity-based tables | |
| Meta | action_type array | action_values | All-level rollup |
| TikTok | Metric columns | Metric columns | Separate per level |
Once each platform is properly structured, the next step is to build a master aggregate table that standardizes metrics and enables true cross-channel analysis.
Why a Master Aggregate Table is Important
While each platform report is useful on its own, meaningful performance analysis happens when data is evaluated across channels.
The challenge is that every platform:
- Uses different naming conventions
- Stores conversion data in different formats
To solve this, create a master aggregate table that standardizes metrics and consolidates reporting into a single, normalized dataset.
The purpose of this table is not simply to combine data, but to normalize it – aligning definitions and naming conventions across platforms.
This enables:
- Cross-channel ROAS
- Unified CAC
- Better ROI calculation
How To Structure The Master Table
The master table should act as a normalization layer, not just a union of platform data.
Across all channel-level reporting tables, standardize the following:
Dimensions
- date
- channel
- campaign
- ad_group
- ad
Core metrics
- spend
- impressions
- clicks
- conversions (standarized definition)
- conversion_value
Standardized KPIs
- purchase
- lead
- booking
- etc.
Effectively, this will create a table with column labels for each of these metrics.
| date | channel | campaign | spend | impressions | clicks | purchase | purchase_value |
|---|---|---|---|---|---|---|---|
| 2/15/26 | Brand | 1200 | 10000 | 1000 | 18 | 3600 | |
| 2/15/26 | Meta | Prospecting | 900 | 100000 | 1000 | 14 | 2400 |
| 2/15/26 | Tiktok | Awareness | 750 | 75000 | 500 | 2 | 200 |
From here, cross-channel KPIs can be calculated consistently.
This master table becomes the foundation for high-level analysis like:
- Executive dashboards
- Budget allocation analysis
- Incrementality modeling
Without it, reporting remains siloed by platform.
Data Validation & Attribution Considerations
When implementing platform integrations, consistency is critical.
Before relying on cross-channel reporting, validate that the following are aligned across platforms:
- Timezone
- Currency
- Attribution window
These are areas that will cause some variation in reporting data when not held consistent across platforms.
In the case of comparing cross-channel, attribution windows will vary. Ensure you understand whether you are evaluating:
- 30-day click
- 7-day click
- 1-day view
Normalization across these as much as possible is recommended. Fivetran includes attribution model reporting for more advanced analysis we’ll cover more in a future article.
Attribution & Reporting Caveats
This report does not deduplicate reported conversions. It standardizes conversion structures.
Because each platform attributes conversions independently, cross-platform double counting will occur when evaluating platform-reported conversions.
For example, Meta, Google & TikTok may all claim credit for the same purchase.
This is simply how platform attribution models work. That’s why when making decisions, use multiple sources of truth for more confidence in analysis.
Scalability
Once the normalization framework is in place, adding new channels becomes straightforward.
For additional platform intregrations (e.g. Reddit, Pinterest, X):
- Follow the ERD schema in Fivetran’s documentation.
- Identify the core performance report table.
- Standardize dimensions and metrics.
- Map conversion events into your existing KPI structure.
Because the master table is designed as a normalization layer, new channels can be incorporated without restructuring your reporting model.
Getting Started with Data Integration
Fivetran streamlines a process most marketers are already doing manually – creating a structured, normalized report.
Traditionally, this requires exporting reports, aligning metrics, reconciling discrepancies, and rebuilding dashboards repeatedly. With a data integration like Fivetran, the ingestion layer is automated.
When paired with a well-designed master aggregate table, this framework does more than save time. It enables meaningful cross-channel analysis, standardized conversion tracking, and consistent revenue reporting.
Implemented correctly, this approach shifts reporting from fragmented platform dashboards to unified business-level analysis.
For marketers managing multiple channels and backend infrastructure, this is a no-brainer implementation to take analysis and decision-making to the next level.