How I Automate Weekly Marketing Reporting (Without Breaking Analysis)
Marketing reporting is only as good as the insights it provides into strategy. To get there, work must be done to standardize data and format it so it clearly shows trends.
Only then can marketing data be analyzed and acted on. That means building a bulletproof weekly reporting framework is the first order of action.
From there, automation becomes key – efficiency gained, more time spent on analysis. However, there are key considerations for when to and when not to automated marketing reporting.
The challenge is knowing when automation adds leverage, and when it introduces fragility.
This article looks at exactly how I automate weekly marketing reporting, with an emphasis on building systems that hold up as complexity increases. I’ll also touch on how this approach changes by company size.
For first-timers, the goal is to make the process approachable and easy to get started with, while still grounding it in principles that scale.
Skip straight to the implementation guide
TL;DR
In this article, you’ll see:
- How I structure platform data to aggregate reliably each week
- Why Google and Social data are normalized separately before being combined
- How a single master data file simplifies weekly analysis and reporting
- Where automation adds leverage and where manual interpretation still matters
- How the same reporting structure adapts as teams and data volume grow
The Reporting Outcome I’m Automating Toward
Regardless of the company size, the goal of marketing reporting stays the same: communicate a clear picture of what’s happened and what we expect to happen.
To do this, analysis of trends on a weekly cadence provides the clearest picture. The process ends with human interpretation – a necessary component of the process.
Automation enters as a time-saving tactic after the report has built. The key is to avoid automating anything that might change in the future.
Building An Automation Stack
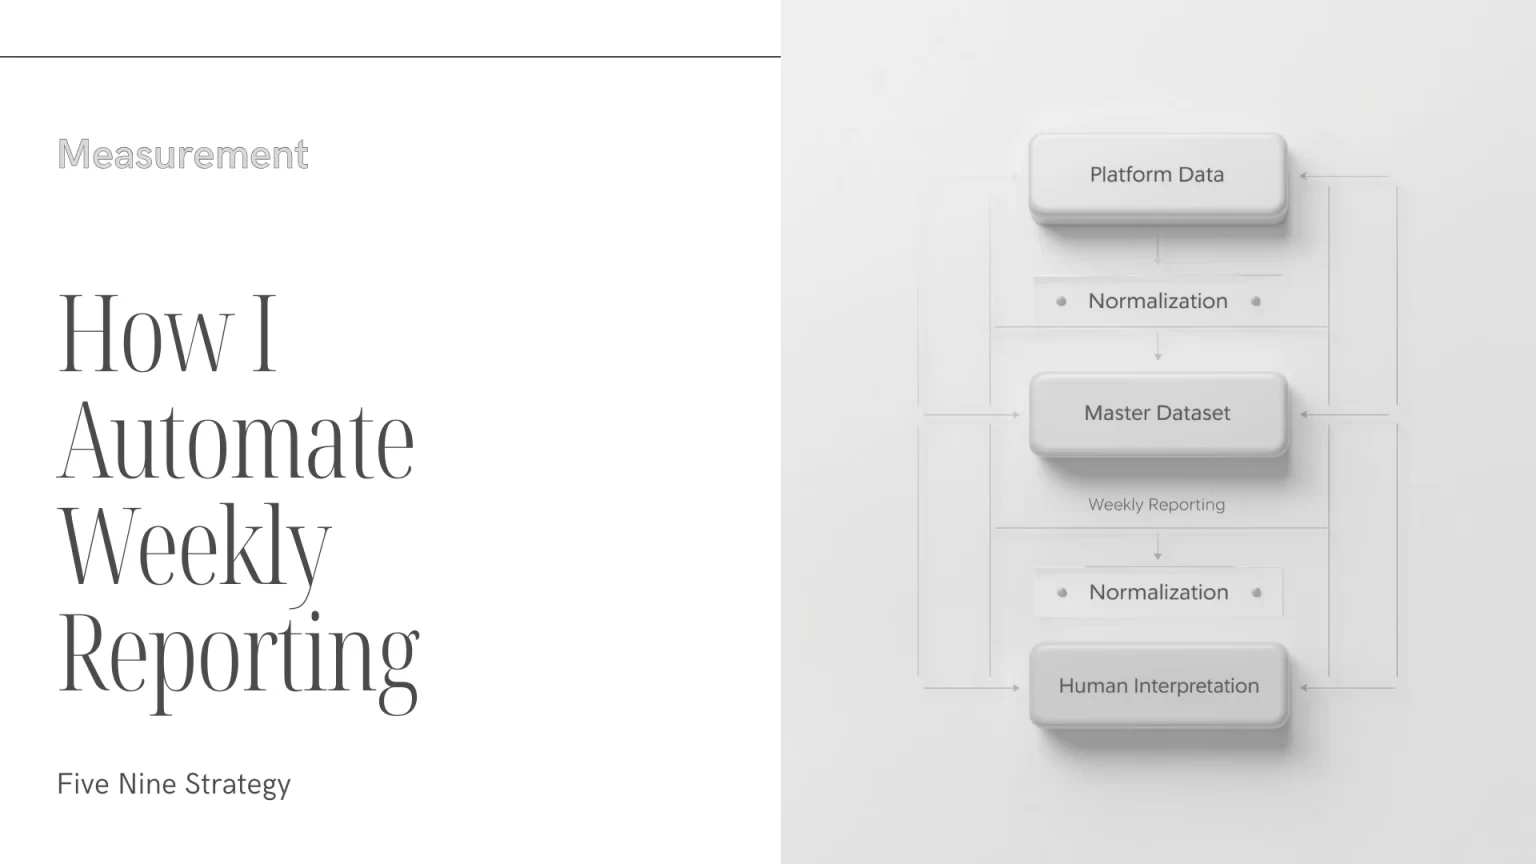
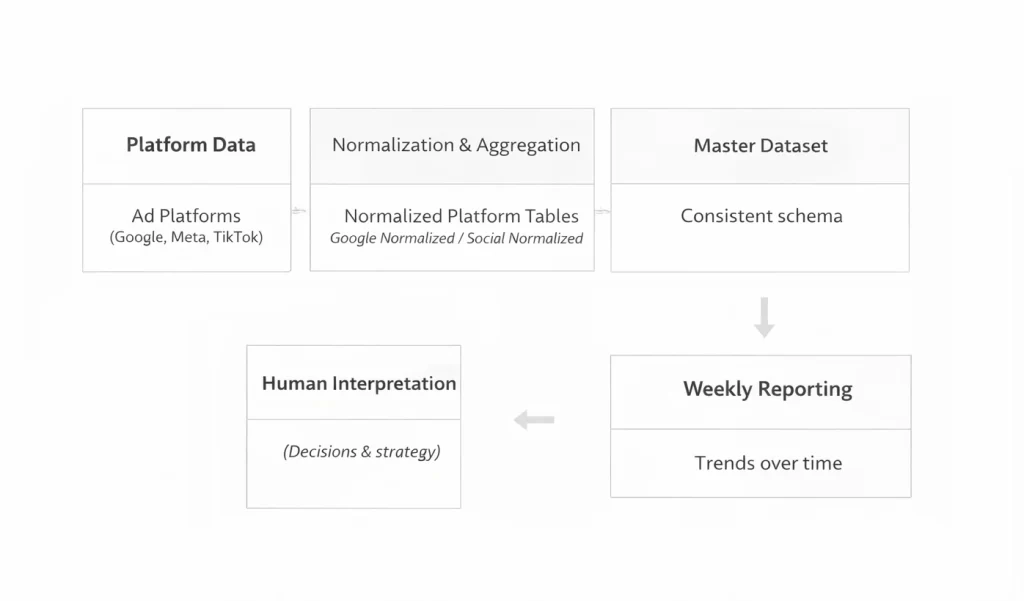
First order of business: identify what steps of the reporting process can be automated. I like to think of it in 4 steps.
Platform → Aggregation → Spreadsheet/Warehouse → Visualization
Platforms are where the data lives, and don’t require automation. The steps that move data between systems (i.e. platform → spreadsheet → visualization) are where automation comes into play.
Aggregation: Data Ingestion
The most mundane task involved in any marketing report is first acquiring data from platforms and aggregating it. Done manually, this process involves downloading CSV’s and matching the column between platforms to create a unified sheet.
These manual files need to be re-pulled whenever a new report is generated, creating a ton of manual work.
One tool that speeds this process up is Supermetrics.
Supermetrics: Automate Spreadsheet Data
To set up Supermetrics queries, simply connect the platform (via login credentials) to a Supermetrics account. This requires a paid subscription.
Then begin setting up each data pull.
For my reports, I start with spend and conversions as the highest priority queries.
Step 1: Set Up Google Ads Queries
Google Ads requires 1 query for core metrics (impressions, spend, clicks), and individual queries for each additional conversion action.
The core query is straightforward to pull – simply select traffic metrics like cost, clicks, impressions, video views, etc. and breakdown by date and campaign (at a minimum).
Conversion queries are slightly trickier. First select the same dimensions: date and campaign. Then select metrics ‘all conversions’ and ‘all conversion value’ if you track value.
Then in the ‘filters’ section, select ‘conversion tracker id’ and find the conversion ID for the action you want to track.
The conversion ID can be found in the URL when you click into the conversion action (look for ct=).
Once these queries are set up, make sure to schedule them to refresh weekly.
Step 2: Set Up Social Ads Queries
Social channels like Facebook have a simpler process. Pull core metrics the same way as Google – focus on spend, clicks, and impressions to start.
Then set up a second query with all relevant conversion actions. Supermetrics allows pulls for standard events as well as any custom conversions all within the same query.
TikTok is slightly clunkier. In a similar fashion, pull core metrics in one query. Then set up a second query for conversions.
Conversion queries for TikTok operate similar to Google except – choose the ‘conversions’ and the value for the conversion action. Then, set up a filter using ‘conversion event’ and the name of the conversion you want to track.
This process needs to be repeated with individual queries for each conversion you want to pull.
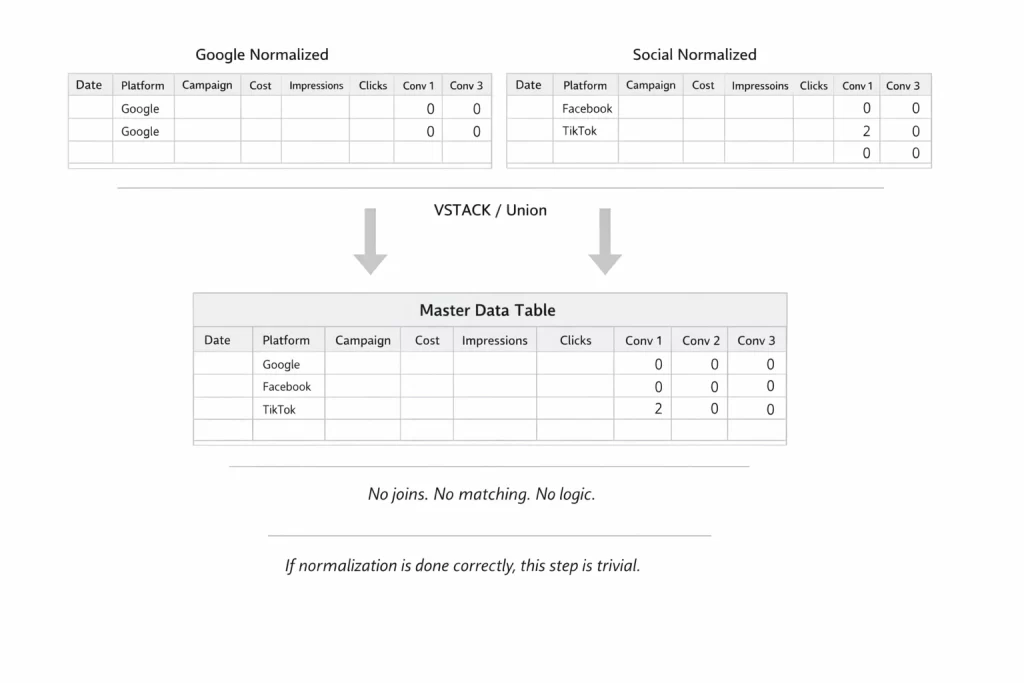
Step 3: Set Up Normalized Data Sheets
Before creating a master data file, Google queries and Social queries need to be aggregated into respective tabs. The goal is to match core metrics and conversions using date and campaign name as common identifiers.
To do this, use Google Sheets’ built in formulas.
The array will be set up using column labels from the Supermetrics queries, and look something like this:
| Date | Platform | Campaign | Cost | Impressions | Clicks | Conversion 1 | Conversion 1 Value | … |
|---|
To achieve a clean aggregate, data needs matching column labels and missing metrics filled with zeros.
Query and VSTACK functions create a normalized table and aggregate the queries by date, platform, and campaign.
The full implementation is available in the resource hub
Step 4: Set Up Master Data Sheet
Once data is normalized into Google and Social sheets respectively, creating a single master data file is easy.
Again, a VSTACK formula is used to aggregate both tabs into a single array.
The key to this process is having unique lines for each platform that includes all conversion data – even if conversions aren’t the same on each platform.
At this point, most of the mechanical work is done.
Data is ingested, normalized, and combined into a stable master file. From here on, automation is no longer about moving data. It’s about deciding what should be automated, and what should stay human.
Visualization: Weekly Aggregation
Now that the master dataset is built, it’s time to turn it into a decision-making tool. That means building a weekly performance report that analyzes trends.
For a low stakes environment, start with pivot tables in Google Sheets.
Crafting Weekly Report Tables
Pivot the master data file and create two tables:
- Spend by week
- Conversions by week
Use platform as a breakdown to better understand the impact of each channel – one step closer to media mix modeling
Throw in campaigns as a breakdown for more granular performance, but generally aggregate trends are easier to analyze.
This is where it gets fun – look for the three trends that actually matter. Is CPA elastic, or is it increasing in a linear fashion with spend?
Finding the patterns in those trends are what drives future strategy decisions.
What I Don’t Automate
Automation is great at taking repetitive process and streamlining it. It does not however replace thoughtful analysis.
The same principle applies to automating campaign management – automation should improve efficiency, not replace judgement.
Decision making around budget allocation and creative performance for example are always subjective. How much budget is increased or decreased following performance fluctuations is up to discretion.
The key is having the data to inform once that change is made.
Similarly, ad hoc or anomaly investigation shouldn’t be automated. These involve sudden changes in spend due to campaign setting changes, market factors, or creative updates.
If it’s a process that’s only being completed once every month, don’t waste your time automating it.
Finally, strategic planning is rarely a process that is automated. This involves auditing accounts and developing new marketing plans.
Analyzing things like geography, demographics, audience targeting, messaging variations, and the many more components involved in a digital marketing campaign often need to be assessed manually.
Once a cadence of analysis is established however, automation plays a key role in improving efficiency and speed-to-insight.
How This Changes by Company Size
For the purpose of process, company size can be broken into three tiers.
- Small Teams (1-2 people)
- Mid-sized teams (2-10 people)
- Larger Orgs (10+ people)
Small Teams (1-2 People)
The method explained above – relying on Supermetrics and sheets – is perfect for a small team or solo operator.
Data aggregation costs the price of a Supermetrics license, or for the cost-sensitive, the time it takes to manually pull CSVs from each ad platform.
Pivot tables are used to manually interpret data, and decisions can be made with relative ease.
Mid-sized Teams (2-10 People)
Now more process and standardization is necessary as well as a purpose for any data visualization being created.
This might look like a dedicated creative performance pivot or table looking at engagement and conversion by content topic, or an executive style dashboard that trends core KPIs on a weekly basis.
The key is clear ownership of each report by a team and regular usage. Otherwise, it isn’t worth the time to set up the automation in the first place.
Larger Orgs (10+ People)
The same logic applies to larger orgs, only now the data storage becomes more sophisticated. Where MarTech platforms are all feeding data into a central repository – a data warehouse – more advanced reporting is possible.
At this stage, ingestion typically shifts to warehouse-native connectors that sync platform data directly into BigQuery or Snowflake. I’ve outlined how to build that type of system using Fivetran to automate Google, Meta, and TikTok reporting at the warehouse level.
With infrastructure in place, analysis expands beyond cost per conversion. Performance can be evaluated by new vs returning customers, first-click attribution, or customer lifecycle value (LTV).
These analyses require integrations across CRM, CDP, ESP, and payment systems. The setup is more technical, but once established, it unlocks far more impactful insights.
Closing Thoughts
Automating weekly marketing reporting isn’t about building the most complex system possible.
It’s about deciding which parts of the process are stable enough to automate, and which parts should remain human.
Once data is ingested, normalized, and aggregated into a consistent weekly view, the mechanics largely disappear. What remains is interpretation: understanding trends, questioning anomalies, and making informed decisions about what to do next.
The tools will change as organizations grow. Spreadsheets turn into warehouses, pivots turn into dashboards, and queries become more sophisticated. But the underlying logic stays the same.
Good reporting isn’t just defined by efficiency, but how clearly it supports better decisions. That’s automation working as it’s intended.