Why Static Metrics Break Marketing Reporting
Marketing reports sit at the core of performance marketing. They determine what teams learn, what gets optimized, and ultimately which ideas survive.
The problem is that most reports answer the wrong question. They tell us what the CPA is right now, but not what’s changing or why performance is moving. Numbers without context don’t explain behavior.
In practice, marketing doesn’t fail because campaigns are poorly planned. It fails because reporting systems strip away time, spend context, and direction. That leads to poor decision making when optimization becomes reactive.
This article breaks down why static metrics consistently mislead, why spend and trends matter more than snapshots, and how better reporting leads to better decisions.
TL;DR
- Static metrics like CPA and ROAS mislead when viewed without time and spend context.
- Week-over-week trends reveal system behavior far better than daily snapshots.
- Nearly all performance insights come from three relationships: spend vs conversions, CPA vs spend, and volume vs efficiency.
- Poor reporting kills good campaigns early and rewards decisions that look good in the short term but harm long-term growth.
Why Static Metrics Mislead
A lot of marketers will look at the CPA, note it’s changing over a period of time, and call it a day. If the CPA went down, great! Marketing is doing it’s job well. If it went up, there must be a reason that’s not our fault. (I kid of course, sometimes it is).
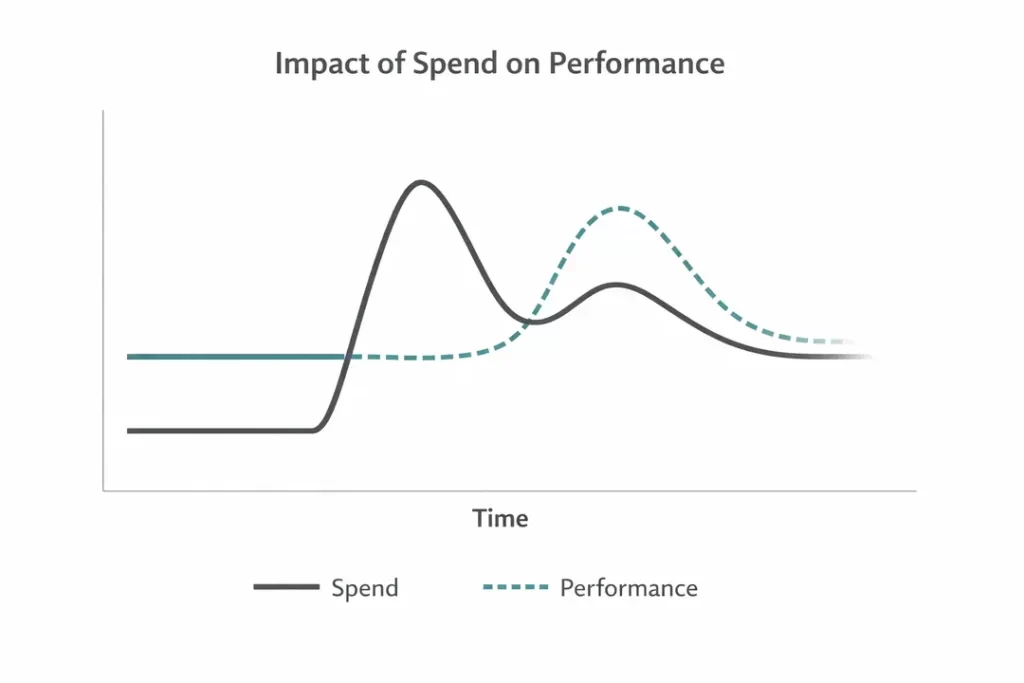
The problem is this misses the ‘why’. Increasing spend can increase CPA in the short term before conversions have a chance to catch up.
This looks even more drastic in bottom of funnel channels or retargeting campaigns where CPA is the primary metric of measurement.
Even deeper, creative performance that relies on CPA instead of attention metrics and micro-conversions that signal intent misses the true insights of what’s working.
Spend Is The Missing Axis in Most Reports
Spend isn’t just another metric. It’s the common thread between all marketing metrics that explains why performance changes.
Most reports treat spend as a background input, assumed to be stable. But flat spend doesn’t mean a stable system. It just means the system isn’t being tested.
Marketing only reveals how it works when spend changes. Increasing or decreasing spend exposes how demand is created, captured, or constrained over time.
Rising spend is often labeled “inefficient,” while declining spend is treated as improvement. These are usually flawed concepts.
What looks like inefficiency during scale is often conversion lag or platform learning. What looks like efficiency during pullback is frequently short-term capture without future demand creation.
Spend changes don’t create performance issues – they reveal them. When spend increases and results stall, it highlights weaknesses in targeting, creative, or offer. When spend decreases and results hold, it exposes inefficiencies that were already present in the system.
Why Weekly Trends Reveal Reality
Once you accept that static snapshots mislead, the real question becomes cadence.
The goal with trend analysis is removing as much uncertainty as possible. This comes from:
- Daily fluctuations
- Attribution lag (buying cycles)
- Platform learning windows
Daily performance is dominated by this noise. Reading too much into day-to-day changes trains teams to be reactive instead of understanding deeper.
Weekly trends, by contrast, reveal direction. They smooth short-term volatility while remaining close enough to execution to inform decisions.
Trends show whether the system is improving or degrading over time, giving directional insight that’s far more valuable than any point in time.
Good reporting aims for clarity over time rather than momentary analysis.
The Three Trends That Actually Matter
Nearly every performance story can be boiled down to three relationships. This framework focses on spend, volume, and efficiency relative to one another over time.
That doesn’t mean other metrics or KPIs are worthless. Good marketers will still analyze them, but stories are told through three simple trends.
Spend vs. Conversions (Direction, Not Totals)
Conversions are only meaningful when viewed alongside spend.
Rising conversions with flat spend signal improving efficiency. Flat conversions during spend increases often reflect lag or learning rather than failure. Falling conversions during spend pullback are expected, not alarming.
The direction of change matters more than the absolute number.
Note: Secondary metrics like cost per click or micro-conversions diagnose traffic intent or stage of customer journey.
These answer valuable questions about how ready your audience is to buy and the length of consideration.
CPA vs. Spend (Elasticity)
CPA is not a fixed benchmark. It’s elastic. As spend increases, CPA almost always rises before stabalizing at a new benchmark.
Short-term increases to CPA don’t signal poor campaign optimization or setup, but rather how CPA responds to change in spend.
The question isn’t whether CPA increased, but whether volume and downstream impact increased alongside it. This ensures:
- Campaigns aren’t killed early
- Reporting has valuable context
- Optimizations reflect true performance
Note: Ad performance forecasting helps estimate this so you aren’t caught off guard when costs rise.
Volume vs. Efficiency (The Tradeoff Curve)
Every marketing system operates along a tradeoff between volume and efficiency. Especially in situations like Feeder campaigns where most traffic is not at the point of being ready to buy.
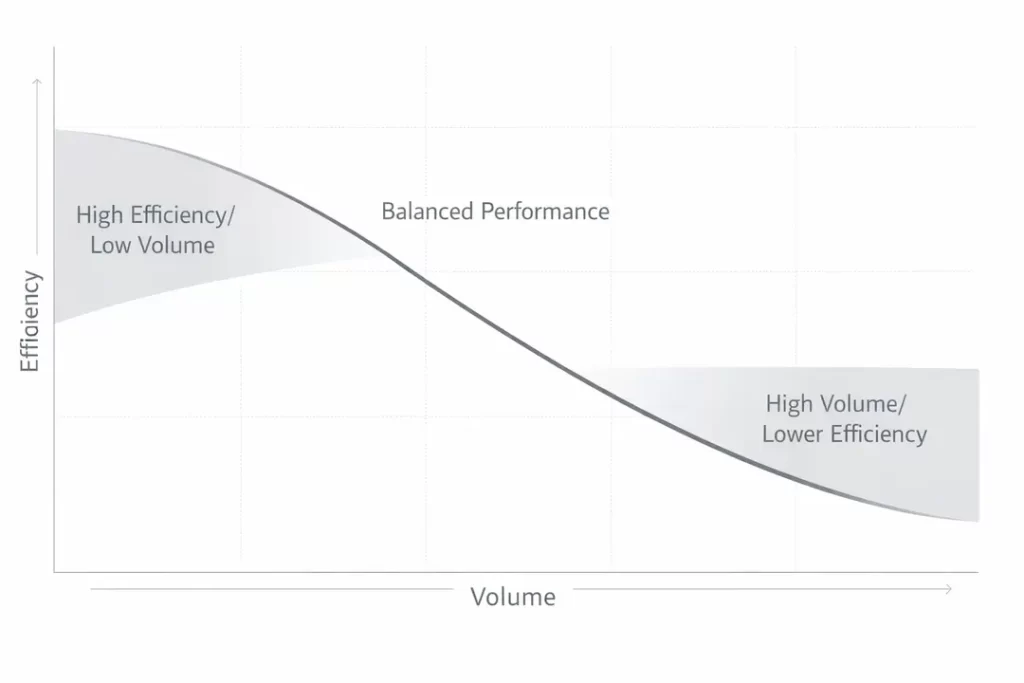
Maximum efficiency rarely coincides with maximum growth. Charting conversions vs CPA shows this.
Every marketing system operates on a tradeoff curve between volume and efficiency. Optimizing exclusively for low CPA often constrains scale and understates opportunity.
Good reporting makes this tradeoff visible instead of pretending it doesn’t exist.
How This Changes Optimization Decisions
When reporting focuses on trends and relationships rather than snapshots, optimization decisions change fundamentally.
Let’s look at three common scenarios and how to approach each the right way.
When to Scale Despite Rising CPA
A common instinct is to pull back on spend when CPA rises, but this ignores the fundamentals.
Rising CPA during periods of scale is often a signal of demand expansion, not failure. When spend increases, platforms move beyond the most efficient pockets of inventory.
Instead, looking at additional factors provides context.
- Did conversions also increase
- How long has it been since spend increased
- Are downstream signals improving
Rising CPA isn’t inherently a problem as long as performance is strong directionally (micro-conversions, conversion volume).
If volume is growing faster than efficiency is deteriorating, scaling is possible.
When to Pause Despite “Good” Performance
Pausing campaigns that appear to be performing well can be one of the most impactful optimization decisions, but often misunderstood.
See how CPA can be misleading in Performance Max campaigns
Strong efficiency metrics don’t always indicate success. In many cases, they reflect constrained spend or over-reliance on warm audiences and existing demand rather than incremental impact.
This is especially common in campaigns that disproportionately capture demand that already exists. When spend is reduced in these systems, efficiency often improves despite no meaningful change in strategy or execution.
Without clear spend trends in reporting, this can be misread as optimization progress rather than demand saturation.
Good reporting makes this visible. It shows when efficiency gains are driven by reduced exposure instead of stronger performance.
In certain cases, this will reveal campaigns that aren’t contributing real incremental value, like branded search campaigns.
Pausing in these cases isn’t about cutting waste blindly. It’s about reallocating spend away from activity that captures demand passively and toward efforts that create or expand it.
Read why I recommend to pause branded search campaigns that aren’t providing unique value
How To Avoid Killing Campaigns Early
Nearly every marketer has shut down a campaign that would have worked if given more time. The mistake is usually attributed to creative, targeting, or platform performance, not measurement.
Short reporting windows, snapshot metrics, and missing trend context make early performance look worse than it is.
This is how good campaigns die. Reporting that emphasizes immediate efficiency trains teams to optimize for appearance instead of durability. Campaigns are paused, learning resets, and long-term performance is sacrificed to protect short-term metrics.
Good reporting changes this dynamic. It explains why campaigns are necessary, as well as why some need to be paused. The key is analysis that looks at multiple data points as well as trends instead of static snapshots.
Instead of asking whether a campaign looks good today, it asks whether the system is strengthening, stabilizing, or breaking down.
Why Executives Misread Performance (And How to Fix It)
Reporting has to work for all stakeholders involved in decision making. That usually means tailoring stats and stories for executive level that emphasize outcomes without trajectories.
Executive summaries that highlight static efficiency metrics without showing how spend, volume and performance are evolving together encourage reactyive decisions. CPA increases lead to budget cuts, or declaring victory when efficiency improves due to reduced spend.
Trend framing reduces reactive decisions like killing a campaign just because CPA increased.
Reporting systems shape organizational behavior. Reports are framed to make marketing teams look good rather than how to drive sustainable growth.
Trend-based reporting shifts the conversation from judgment to diagnosis. Instead of asking whether performance is “good” or “bad,” leaders can ask whether the system is strengthening, weakening, or approaching a constraint.
Reporting Is A System, Not A Dashboard
Marketing performance doesn’t fail because campaigns stop working. It fails because reporting systems train teams to make reactive decisions.
Dashboards, while useful, don’t substitute analysis and contextual inference. Trends, spend context, and directional analysis reveal how systems actually operate.
When reporting captures those relationships, optimization becomes intentional instead of defensive.
Start with simple metric-level analyses that look at trends over time and form initial hypotheses. Then, include additional metrics into analysis to add depth to assertions.
Once insights are formed, simplify them to communicate to a broader team. By creating this robust, yet streamlined, reporting, data has the most opportunity to make an impact and affect real change.
Reporting isn’t just a reflection of performance – it’s part of the system itself. Teams that report trends and context scale with confidence. Teams that report snapshots optimize themselves into stagnation.