

How to Set Up Your First Media Mix Model
Proving what works in advertising used to be as easy as setting up a website pixel and tracking what ads drove conversions. These days with multiple devices, long decision phases, and a million ways to learn about new products, pixels don’t cut it.
The need however remains: understanding what is driving new customers for your business is the only effective way to scale. Enter media mix modeling.
A statistical analysis that aims to prove the effectiveness of each marketing channel, online or offline. Simply provide inputs, and a statistical model works out what deserves the most credit.
Simple in theory, very hard in practice. Let’s look at what elements go into a media mix model and how you can set one up for yourself.
TL;DR
A simple media mix model helps you understand which channels actually drive sales — without needing advanced statistics.
To begin, collect:
- 2+ years of weekly KPI + spend data
- Rolling averages to smooth time lag
- A linear regression
- Three basic controls (seasonality, trend, promotions)
The output: real channel contribution, marginal ROI, and a clearer view of where your marketing dollars actually work.
Media Mix Model for Beginners
In it’s simplest form, a media mix model looks at two main components:
- Key Performance Indicator (KPI) – sales, revenue, leads – pulled from your backend/CRM
- Marketing spend (by channel, by week)
The question you’re trying to answer: When I increase spend on a channel, do sales increase?
If you haven’t brushed up on marketing incrementality measurement, that’s a good place to start.
Step 1: Gather 2+ Years of Clean Data
Start with two years of historical data. Make sure data is broken down by date so you can look at weekly trends.
You’ll need two files:
Your KPI File (Backend / POS / CRM)
Should include:
- Date
- KPI value (sales, revenue, leads, etc.)
Your Media Spend File
One row per date per channel. Aggregate your different data sources into one file for ease of analysis.
- Date
- Channel (Meta, Google Search, YouTube, Programmatic, etc.)
- Spend
Tip: Break out tactics (brand vs non-brand, prospecting vs retargeting, etc.) for more granularity, and better insights.
Step 2: Align and Merge Your Data
Following a simple structure, merge data and standardize your column labels.
| Week | KPI | Meta Spend | Google Search Spend | YouTube Spend | Display Spend |
|---|
Make sure any missing spend is filled in with zeros (not blanks). To do this, simply highlight your data field and use find + replace to change ‘blank’ to ‘0′.
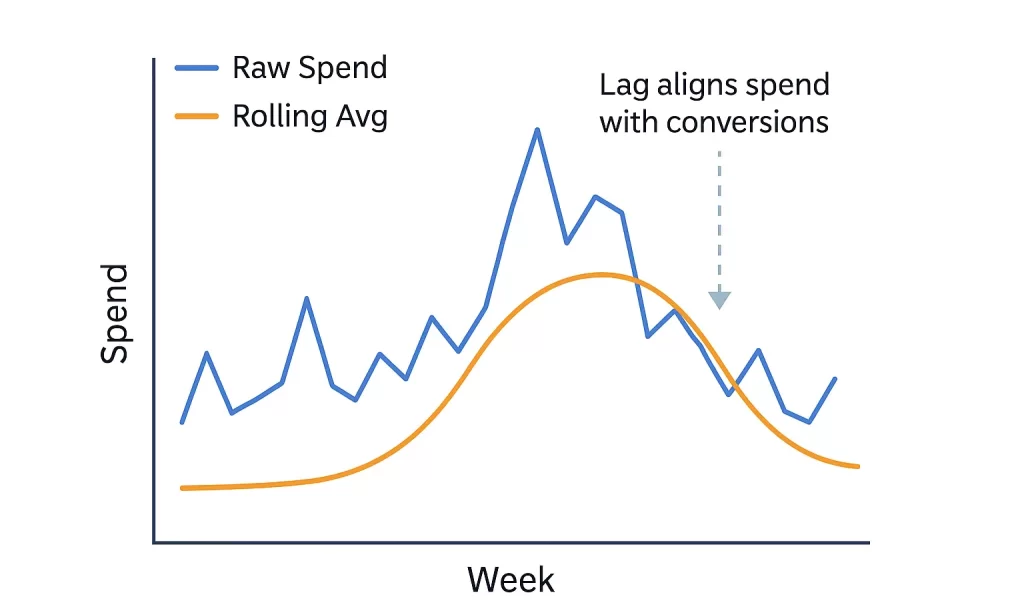
Step 3: Account for Conversion Lag (Rolling Averages)
Most ads don’t drive same-day conversions. We’ve reviewed this in Google’s conversion lag and Meta’s attribution lag metrics.
MMMs that don’t factor time lag fail, because they don’t see the effect of spend on later sales.
To do this, we’ll use a rolling average.
Rolling Averages (Simple Fix)
Rolling averages smooth out weekly spend to blend impact across time and minimize noise from big spend spikes like holidays or promotions.
Let’s say your Meta spend looks like this:
| Week | Meta Spend |
|---|---|
| 1 | $2,000 |
| 2 | $2,500 |
| 3 | $3,000 |
| 4 | $6,000 |
| 5 | $4,000 |
You’re attribution lag from Meta is 15 days on average. You’ll need to create a rolling average that ignores the first two weeks, a 3-week rolling average.
| Week | Meta Spend | 3-Week Rolling Avg |
|---|---|---|
| 1 | $2,000 | — |
| 2 | $2,500 | — |
| 3 | $3,000 | $2,500 |
| 4 | $6,000 | $3,833 |
| 5 | $4,000 | $4,333 |
To calculate the rolling average, take three weeks of spend and calculate the average for each week.
Rolling Avg (Week 4):
= (Week 2 + Week 3 + Week 4) / 3
= (2500 + 3000 + 6000) / 3
= 3833
You can create a simple Rolling Average column for each channel in Excel using the following formula:
=Average(B2:B4)
Step 4: Run a Simple Linear Regression
A linear regression turns simple raw data into useful insight. Effectively it answers the question:
“When I increase spend on a channel, does my KPI increase?”
To do this, the regression uses a formula that takes into account
- KPI: weekly sales, leads or revenue
- Channel Spend: how much weekly spend fluctates
- Coefficients: the impact of each channel on the KPI
- Baseline: performance with $0 spend
- Error: anything the model can’t explain
What Coefficients Mean
In short, the coefficient is the contribution to the KPI from each channel. Let’s say the regression gives you this:
| Variable | Coefficient |
|---|---|
| Meta_Spend | 0.8 |
| Google_Spend | 1.4 |
| YouTube_Spend | 0.2 |
| Display_Spend | 0.1 |
Google is driving the strongest performance – for every additional $1 it drives 1.4 sales on average. Conversely, Youtube and Display are driving very little lift.
Note: This is common with upper funnel channels with more variable sales cycles.
These coefficients are direction insight rather than causal, so take them with a grain of salt. Adding additional controls like seasonality improve the quality of coefficient insight.
Step 5: Add Basic Controls (Seasonality, Trend, Promos)
Controls keep your model from giving credit to media when external factors had an effect on business performance.
For example, all business models have seasonal swings – B2B slows during the Holidays, retail spikes in Novemeber-December…
Adding controls for these periods in your data help the model understand differentiate between media impact and external factors.
Seasonality Controls
Two simple ways to include seasonality markers in your data is by using Month or Quarter markers.
Adding these to your data is as simple as adding additional columns.
Month Example:
| Week | Month | KPI |
|---|---|---|
| Jan 7 | 1 | 200 |
| Jan 14 | 1 | 210 |
| Feb 4 | 2 | 240 |
Month breakouts allow you to see more granular seasonal changes like Back-to-School in August or Black Friday in November.
Quarterly breakouts are a little more general since they offer only 4 distinct categories.
Quarter Example:
| Q1 | Q2 | Q3 | Q4 |
|---|---|---|---|
| 1 | 0 | 0 | 0 |
| 1 | 0 | 0 | 0 |
| 0 | 1 | 0 | 0 |
| … | … | … | … |
These work great for industries with longer seasonal chunks like Flooring, Travel, Automotive, and more.
For beginners, starting with Quarter seasonality offers a simpler way to look at the data since there are fewer variables and less noise.
Trend Variables
A trend variable helps differentiate between steady organic growth and media contribution. Consider your business growth naturally:
- Year 1 sales → 5,000 units
- Year 2 sales → 6,000 units
- Year 3 sales → 7,200 units
If you do not include a trend variable, your MMM sees:
- KPI going up
- Spend on Meta increasing
- Spend on Google flat
and falsely concludes that “Meta is a huge growth driver!”, when it was simply the business growing on its own.
A trend variable controls for this by tracking the growth or decline of your KPI over time and assigning a baseline slope to work with.
The best part: a trend variable is literally just a counter – a simple time index.
| Week | Trend |
|---|---|
| Week 1 | 1 |
| Week 2 | 2 |
| Week 3 | 3 |
| … | … |
| Week 104 | 104 |
This creates a trend coefficient (similar to our channel coefficients) that is either positive or negative depending on how performance trends over time. This coefficient is also particularly useful for ad performance forecasting.
Promo Flags
Promotions that include discounts or limited time offers will spike your KPI no matter what media spend looks like.
Without controlling for them, the MMM will over-credit channels spending during promo weeks.
To account for these events, simply add another column to the data file.
| Week | Promo_Flag |
|---|---|
| Black Friday | 1 |
| Cyber Monday | 1 |
| New Year Sale | 1 |
| Week with no promo | 0 |
Make sure the Week matches your week start dates. This ensures the model is able to match a specific time period performance to a promotion, not your media efforts.
Start with your largest calendar year promotions, and build out from there.
Putting It All Together
These simple controls turn your regression formula from a simple Spend to Sales correlation, to a model that understands seasonality, natural growth and promotion-driven performance.
This controls for three of the biggest sources of bias in MMM:
- Channels get credit for seasonal surges
- Organic growth gets mis-assigned to media
- Promos inflate channel performance
Step 6: Interpreting Your Model Results
Once your model runs, you’ll get a set of coefficients for each chanel and one for the baseline (intercept). From this, you can derive insights.
Channel Contribution
Each channel coefficient tells you how effective that channel was at influencing your KPI.
- Higher coefficient → stronger incremental impact
- Lower coefficient → weaker impact
In certain cases, you’ll get a negative coefficient – this doesn’t mean the channel ‘hurts’ your business so to speak, but some unexplained timing is correlating it with lower performance.
These coefficients give you your first powerful insight: Which channels actually contributed to growth?
Marginal ROI
The coefficients also let you calculate the impact of incremental ad spend in each channel.
For example, if every $1 in Meta spend leads to 0.8 units of KPI vs 0.2 units from Display, ad dollars are better allocated to Meta.
This lets you better plan for:
- Budget reallocation
- Forecasting
- Awareness spend (when it drives lift)
Once you’ve identified these insights, always check against your logic.
Step 7: Validate Before Acting
Before you move forward with budget shifts, check whether your MMM is reasonable.
Results should reflect expectation to a certain extent.
- Search usually should not be negative
- Meta shouldn’t show a 20x ROAS if your business doesn’t
- Youtube should not be the strongest bottom-funnel channel
If your coefficients contradict common sense, something in your model is off.
Bringing It All Together
A simple media mix model won’t capture every nuance of customer behavior.
It won’t perfectly forecast next quarter’s revenue.
And it won’t always match what the ad platforms tell you.
But what it will give you is something far more valuable:
A clear, data-driven view into what’s actually driving your business.
By stitching together backend data, spend data, and a few thoughtful controls – seasonality, trend, and promotions – you create a model that sees through attribution noise and identifies which channels truly move the needle.
Want to Go Deeper? Try the Interactive MMM App
If you want to explore everything in this guide—and see how MMM behaves with your actual data—I built a free interactive MMM app that does all the heavy lifting for you:
- upload your media + backend data
- apply saturation and adstock
- add seasonality, trend, and promo flags
- visualize contributions by channel
- compare platform attribution vs backend truth
- test budget reallocations
It’s the easiest way to take the concepts from this article and turn them into real insights for your business.