

Why Most Marketers Misallocate Budget (And How MOI Fixes It)
Most marketers allocate budget based on top-line performance: “which markets drive the most sales?” Others rely on assumptions like “our audience mostly lives here.” And simpler still, many set campaigns to national targeting and let the platforms decide.
The result? Your budget gets distributed by population size, not opportunity.
That approach only works if your audience is evenly distributed across every market. Spoiler: it almost never is.
Choosing the right markets to support can be the difference between compounding growth and wasting spend. Here’s how to build a smarter, data-driven framework for market-level budget allocation.
TL;DR
The Problem: Most marketers overspend in large markets due to population-based delivery, not performance.
A Media Opportunity Index (MOI) scores each region on true business potential, not just ad-attributed conversions.
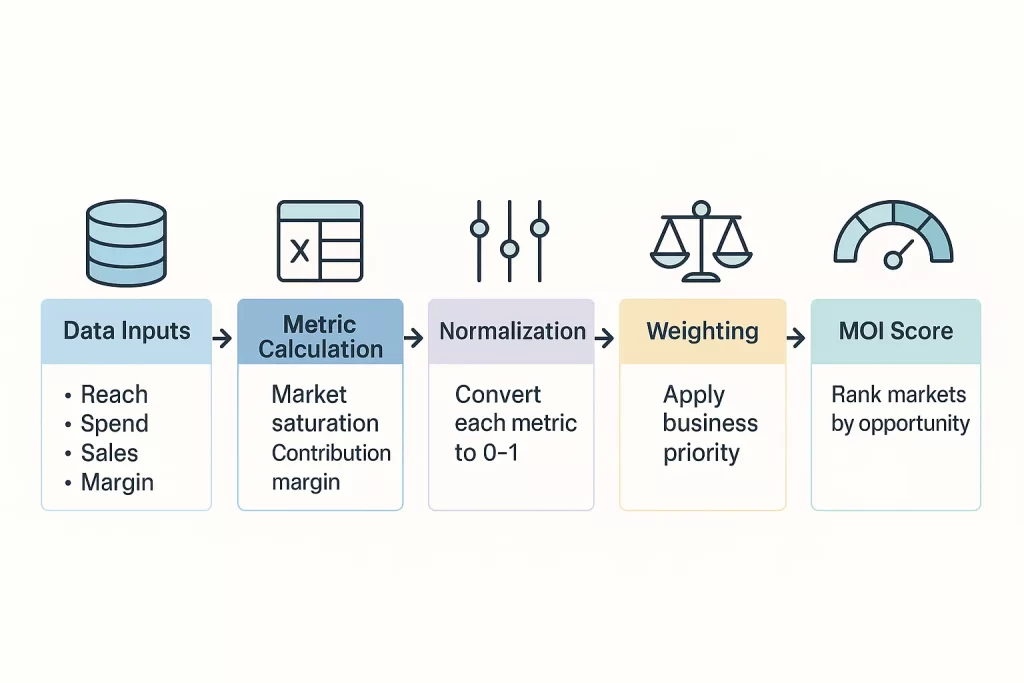
- Combine ad platform metrics (reach, spend, attributed revenue) with backend metrics (sales, margin, store performance).
- Normalize the metrics, weight what matters most, and generate a 0–1 score for every market.
Takeaway: MOI identifies underfunded, high-opportunity markets and budget shifts for incremental growth.
Algorithmic Allocation vs Manual Control: When Each Approach Wins
When Automated Budget Control Outperforms Manual Targeting
Some scenarios actually benefit from letting the algorithm handle budget allocation, especially when your audience is broad and intent is easy to read.
Take e-commerce: if you’re selling something like a pair of shoes, your addressable market is essentially everyone who wears shoes – which is nearly everyone. In these cases, national targeting paired with conversion-optimized bidding tends to outperform manual allocation because:
- The audience is massive
- Demand is consistent
- Algorithmic signals are strong
- Optimization loops close quickly
This approach works especially well for:
- CPG
- Apparel
- Lower-consideration DTC products
- Any category with mass appeal and short decision cycles
When Manual Budgeting Beats Algorithmic Optimization
Manual budget control becomes essential when markets behave differently and measurement signals are weaker—a common scenario in higher-consideration, multi-location, or offline-heavy industries.
If one region consistently underperforms, is it:
- An operations issue?
- A visibility issue?
- A lack of marketing reach?
- Lower brand awareness due to newer store openings?
These nuances matter, and algorithms can’t account for them. Certain markets may require intentional support, especially when:
- Store maturity varies significantly
- Offline sales dominate the purchase path
- Geographic performance is uneven
- Seasonal or limited-time campaigns need precise control
In these cases, allocating budget manually ensures you’re supporting the right markets at the right time rather than letting delivery skew toward population density or historically strong regions.
The Media Opportunity Index: A Smarter Way to Prioritize Markets
Once you understand when to rely on algorithmic delivery and when manual control is necessary, the next question becomes: how do you actually decide which markets deserve more or less budget?
Enter Media Opportunity Index (MOI)
MOI gives you a better way to identify markets with real growth potential, not just the ones with the largest populations or highest attributed conversions.
At its core, a media opportunity index combines a set of inputs to quantify the true opportunity in each region. These inputs typically include metrics such as:
- Reach or impression delivery
- Ad-attributed revenue or conversions
- Total revenue or sales
- Profit margin or contribution
- Store maturity or density
- Other market-specific business indicators
Why These Inputs Matter
The model is designed to answer two foundational questions:
- Which regions have been the most successful?
- Where have we historically focused our media budget?
By looking at both performance and historical investment, the index highlights:
- Markets that are pulling more than their weight
- Markets with untapped upside
- Markets that are oversaturated or overserved
Ultimately, the goal is simple: allocate your budget where it will generate real, incremental business impact, not just where ad platforms happen to spend money.
This is especially valuable in industries like flooring, home improvement, healthcare, education, and others where online attribution is incomplete and sales often close offline.
Let’s walk through how to build the index step-by-step.
What Data You Need to Build an Accurate Market Opportunity Model
Building a media opportunity index follows a simple sequence:
- Gather your historical data
- Organize your metrics by geographic unit
- Calculate performance ratios and derived metrics
- Normalize and weight each metric
- Generate your final index
Before modeling anything, you need the right data inputs.
Your MOI should combine both marketing data and business performance data. Together, these give a complete picture of actual market demand and historical media support.
Recommendation: Use 12 months to account for seasonality and reduce bias from short-term fluctuations.
Note: make sure to account for attribution lag when using recent conversion data.
Digital Signals: Ad Platform Metrics That Feed the MOI
These metrics describe how much media delivery each market has historically received and how effectively that delivery performed.
Useful ad platform metrics include:
- Reach or impressions
- Ad-attributed revenue or conversions
- Store traffic or landing page views
- Ad spend
Platform granularity varies:
- Google Ads: reporting down to ZIP code
- Meta / TikTok / Pinterest: generally DMA-level
- Programmatic DSPs: reporting down to Zip code
Important: Choose a geographic level your backend data can match. Consistency across data sources is critical.
Offline & Business Data: The Metrics That Reveal Real Demand
These metrics help surface real-world performance—especially important when online attribution is incomplete.
Common backend metrics:
- Total sales or revenue
- Profit margin or contribution margin
- Store count or store density
- Regional pricing variations
- Customer demographics (optional)
- Lead volume or appointment data (for services)
Most of this data will come from:
- Your CRM
- POS system
- Payment processor
- Internal BI tables
The more offline signals you include, the stronger and more predictive your index becomes.
Aligning Data to the Right Geographic Level (ZIP, DMA, State)
Once you’ve collected both online and offline metrics, map them to a consistent geographic breakdown:
- ZIP code
- City
- DMA
- State
- Custom trade areas
If your datasets use different granularities (e.g., ZIP codes for Google, DMAs for Meta), you may need to match ZIP → DMA using a mapping resource like the Clarkenheim ZIP-to-DMA database.
Once all metrics are aligned to the same geographic unit, you’re ready to start building the model.
Step 1: Build a Unified Market-Level Dataset
Once your data is aligned to a consistent geographic level, the next step is to consolidate it into a single table. Each row represents a market (ZIP, DMA, city, etc.) and each column represents a metric you want to analyze.
A simplified structure looks like this:
| Market | Social Reach | Total Population | Market Saturation | Ad Attributed Revenue | Total Revenue | Contribution Margin |
|---|---|---|---|---|---|---|
| DMA 1 | Ad platform data | Census data | Social Reach ÷ Total Population | Ad platform data | Backend data | Ad Rev ÷ Total Rev |
| DMA 2 | Ad platform data | Census data | Social Reach ÷ Total Population | Ad platform data | Backend data | Ad Rev ÷ Total Rev |
You can include as many metrics as needed: reach efficiency, store density, revenue per reach, contribution margin, etc. The more inputs you include, the more accurately the index reflects real market opportunity.
Real-World Example: How Three Markets Perform Very Differently
Here’s a trimmed-down example pulled from an actual model. While the full version used 7+ metrics, we’ll focus on two core inputs:
- Market Saturation
- Contribution Margin
| Market | Social Reach | Total Population | Market Saturation | Ad Attributed Revenue | Total Revenue | Contribution Margin |
|---|---|---|---|---|---|---|
| DMA 1 | 1,834,684 | 7,300,000 | 25.13% | $1,502,336 | $11,542,703 | 13.02% |
| DMA 2 | 475,052 | 7,400,000 | 6.42% | $528,878 | $2,570,617 | 20.57% |
| DMA 3 | 6,130,629 | 18,600,000 | 32.96% | $7,700,275 | $24,794,900 | 31.06% |
Before comparing markets, we need to normalize each metric so they’re scored on the same 0–1 scale.
Step 2: Normalize Your Metrics to Compare Markets Fairly
Normalization helps determine what you want to prioritize and puts all metrics into the same comparable range, similar to how we conduct ad performance forecasting.
Market Saturation
Represents how much of the addressable population your ads already reach.
- High saturation → Less room to scale.
- Low saturation → More opportunity to improve reach efficiently.
Because lower saturation = more opportunity, we want to prioritize lower values.
Contribution Margin
Represents how much of total revenue is driven by paid efforts.
- High contribution margin → Market is already active; less upside.
- Low contribution margin → Paid media is under-penetrating; room to grow.
Again, lower values represent more opportunity.
In this example, both metrics should prioritize lower scores as more desirable.
Step 3: Apply Weights to Reflect Your Business Priorities
We normalize each metric relative to the maximum value in the column.
First, identify your maxima:
- Max Market Saturation: 32.96%
- Max Contribution Margin: 31.06%
Then apply one of two formulas depending on whether you want low values or high values to score higher.
When lower = higher opportunity
Use:
Normalized = 1 − (Metric ÷ Max)
When higher = higher opportunity
Use:
Normalized = Metric ÷ Max
Since both of our example metrics reward lower, we’ll use the 1 − (Metric ÷ Max) formula.
Here’s the normalized table:
| Market | Market Saturation | Contribution Margin | Max Market Saturation | Max Contribution Margin | Normalized Market Saturation | Normalized Contribution Margin |
|---|---|---|---|---|---|---|
| DMA 1 | 25.13% | 13.02% | 32.96% | 31.06% | 0.24 | 0.58 |
| DMA 2 | 6.42% | 20.57% | 32.96% | 31.06% | 0.81 | 0.34 |
| DMA 3 | 32.96% | 31.06% | 32.96% | 31.06% | 0 | 0 |
Once all metrics are normalized, you’re ready to assign weights and generate the final index.
The MOI Formula: Turning Metrics Into a Single Opportunity Score
The Media Opportunity Index is a simple weighted average:
MOI = (Normalized Metric 1 × Weight 1) + (Normalized Metric 2 × Weight 2) + …
Applying the weights to our example metrics produces the following:
| Market | Normalized Market Saturation | Normalized Contribution Margin | Market Saturation Weight | Contribution Margin Weight | MOI Calculation |
|---|---|---|---|---|---|
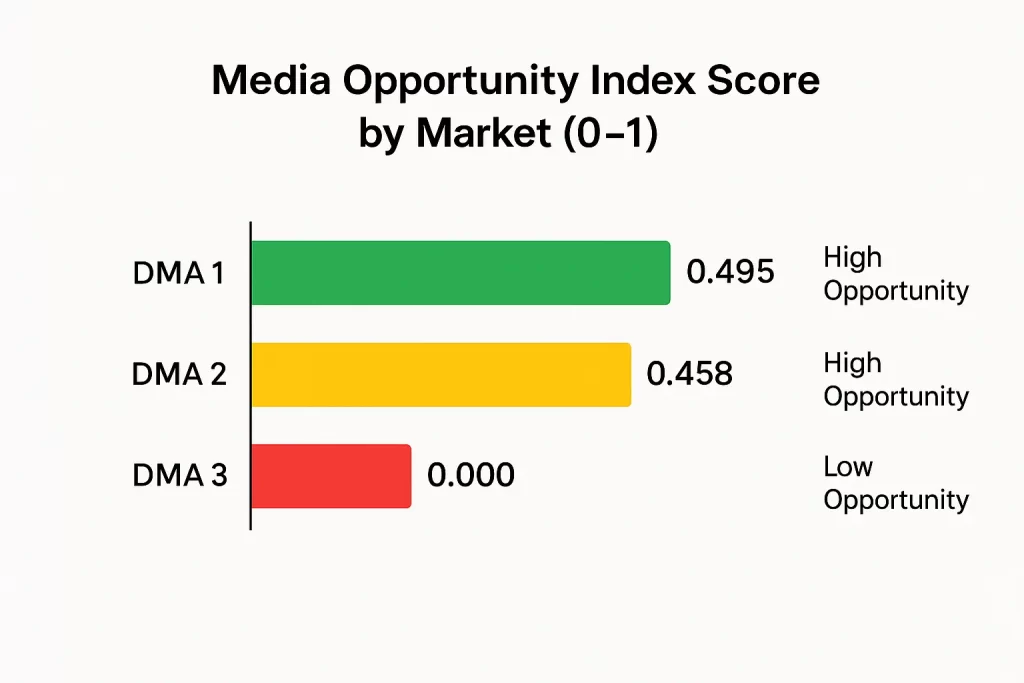
| DMA 1 | 0.24 | 0.58 | 25% | 75% | 0.495 |
| DMA 2 | 0.81 | 0.34 | 25% | 75% | 0.458 |
| DMA 3 | 0 | 0 | 25% | 75% | 0 |
Each MOI score falls on a 0 to 1 scale, where:
- 1.0 = highest growth potential
- 0.0 = lowest growth potential
How to Read Your MOI Scores (High, Medium, Low Potential)
Once you calculate MOI scores for all markets, grouping them into tiers makes the output more actionable:
- High Opportunity → increase support
- Moderate Opportunity → maintain or test into
- Low Opportunity → deprioritize or keep at baseline
In our example:
- DMA 1 and DMA 2 show high opportunity
- DMA 3 shows limited or no opportunity
This framework gives you a quantifiable, repeatable way to make smarter, more strategic budget decisions across markets.
Putting It All Together
A Media Opportunity Index gives you what most advertisers never have: a clear, objective way to see where your next dollar delivers the highest real-world impact. Instead of letting platforms overspend in big markets or guessing where to scale, the MOI highlights exactly which regions have headroom, and which ones are tapped out.
Build it once, refresh it quarterly, and you’ll never allocate budget the same way again. This is how you stop funding saturation and start funding growth.
Want to build a MOI analysis for yourself? Check out my app