
Meta Attribution Lag: How to Measure and Fix Misleading Performance Data
Every purchase follows a process: discovery, consideration, and decision. You might hear about a product from a friend, see an ad, compare options, and finally decide to buy.
The time between those stages—the sales cycle—varies by person and by price. The higher the cost, the longer people take to decide.
For marketers, understanding that timing is essential. It informs how you scale budgets, when to retarget, and how to avoid cutting good campaigns too early.
Ad platforms have labeled this as conversion lag or attribution lag. Google has a dedicated view for conversion lag, but Meta is less transparent. However, with some light analysis, you can derive an attribution lag window that translates into an estimated sales cycle for users on the platform.
Let’s take a look at the benefits of this analysis and how to set up a report to measure it.
TLDR
Attribution lag is the delay between when someone engages with your ad and when they finally convert.
Understanding that delay helps you:
- Allocate budgets more intelligently by accounting for delayed conversions
- Build retargeting windows that align with real buying behavior
- Forecast performance more accurately and compare campaigns fairly
Pro Tip: Don’t judge or optimize a new Meta campaign until at least your average attribution lag has passed. You might be cutting a future winner too early.
What Is Meta’s Attribution Window?
Meta uses the term attribution window to define how long it can link a conversion back to an ad click or view.
For optimization, Meta defaults to a 7-day click, 1-day view window—meaning conversions that happen more than seven days after a click aren’t used to guide delivery.
For reporting, you can view up to 28 days post-click in Ads Manager. This extended view doesn’t affect optimization, but it gives you a clearer picture of which ads ultimately influenced a sale—especially for longer consideration products.
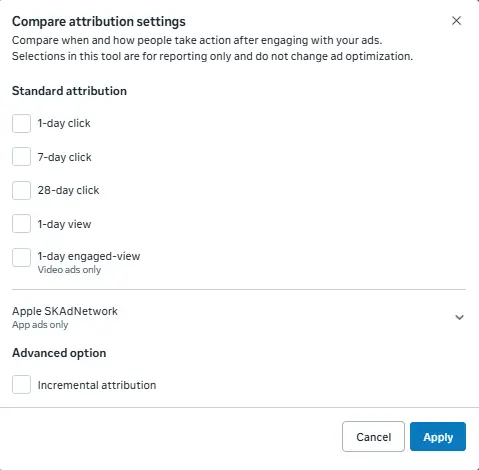
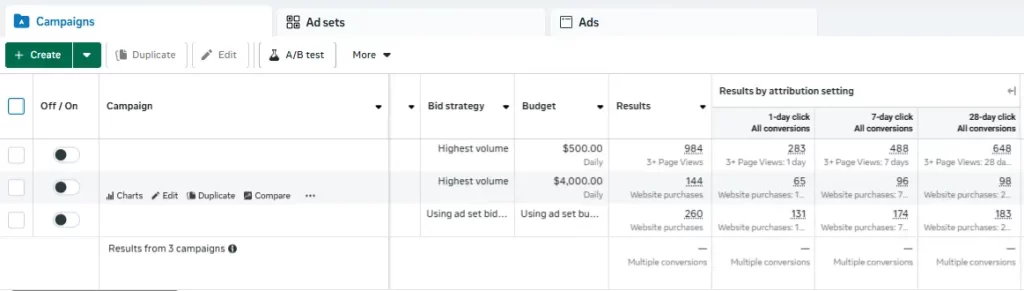
How to Find Attribution Settings in Meta Ads Manager
In the Ads Manager reporting view, navigate to columns > attribution settings.
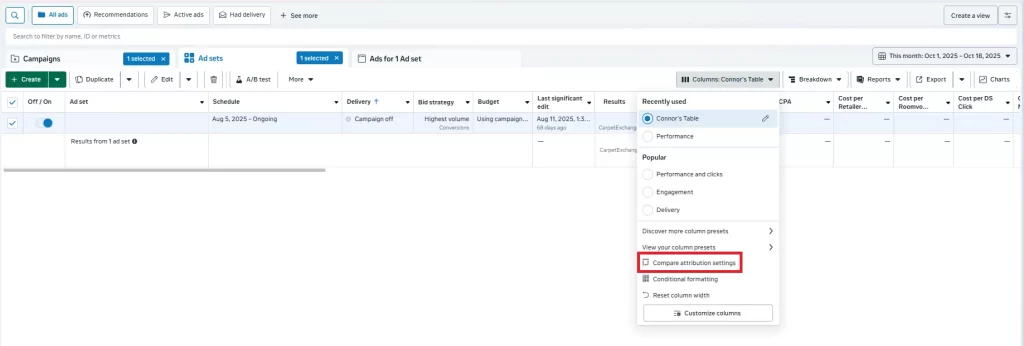
Select compare attribution settings and choose 1, 7, and 28 day click. Hit apply.
You’ll now get a view of your metrics broken out by attribution window.
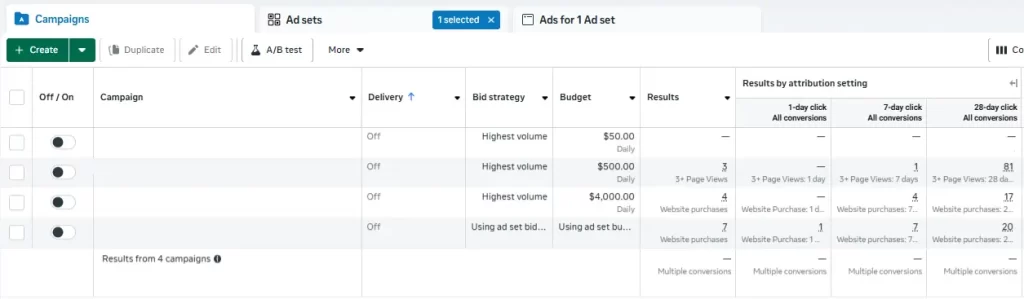
In this example, most purchases happened within the 8-28 day window. While the campaigns did not optimize directly for these events, we’re able to see the campaigns contributed to the ultimate sale.
Why Attribution Lag Matters for Marketers
Attribution lag is less a reporting quirk and more a symptom of attribution models simplifying a multi-step decision process.
Once you understand how long it takes someone to convert, that insight touches nearly every part of campaign management, from budget pacing to retargeting windows to performance forecasting.
Better Budget Allocation
Avoid misjudging campaign performance by accounting for delayed conversions before making spend changes.
Every seasoned media buyer has run into this scenario – the budget increases, conversions stay the same, cost per conversion increases significantly.
The instinctive reaction is to cut spend – ‘it’s not working!’. This reaction disregards how people buy products. Ads don’t accelerate the decision-making process, they introduce your product as a potential solution.
Understanding how long after ad engagement users typically take to convert informs strategy. Instead of pausing a new campaign because the CPA is 30% higher, factor in your average attribution lag for a more accurate performance comparison.
For example, if the 70% of users buy after 1 day, factor an additional 30% reduction to cost per conversion for future activity.
Building Smarter Retargeting Audiences
Use attribution lag data to set smarter retargeting windows so you stay visible while customers are still deciding without wasting spend once interest drops off.
Retargeting is an effective tactic so long as it’s used in the time leading up to a purchase. Again, it won’t typically convince someone to buy a product, but it will re-engage them and remind them to continue considering.
For products with longer sales cycles (and longer attribution lags), retargeting is needed for a longer period of time.
A product that sees 70% of users purchase within 7 days could benefit from a 30-day retargeting audience, since an additional 30% of potential customers are still considering during day 8-30.
Likewise, a product where most people purchase within 7 days might only need a 7-day retargeting audience to effectively maintain product consideration.
Improved Forecasting and Benchmarking
Knowing your average lag helps you predict where performance will settle, set realistic expectations, and compare campaigns on a true like-for-like basis.
Understanding attribution lag allows you to forecast results more accurately and set realistic performance expectations – for your optimization and for communication with external teams.
You can project where performance metrics will ultimately settle to get a quicker pulse check on how a campaign is performing compared to others.
Comparing to Google’s average conversion lag offers even more insight into how your customers are moving through their journey, and where each platform lives in the path to conversion.
Understanding lag improves measurement decisions upstream — budget pacing, testing windows, and when to intervene.
How To Measure Attribution Lag in Meta Ads
To understand when conversions actually happen, you’ll want to break them out by time period. Here’s how to build a simple conversion lag table using 1-, 7-, and 28-day click data.
Step 1: Create Time Buckets (0–1, 2–7, 8–28 Days)
Assign credit to three time buckets:
- 0–1 day: immediate conversions
- 2–7 days: short-term consideration
- 8–28 days: long-term decision makers
From there, calculate the percentage of total conversions each period represents. This shows what portion of your conversions happen after your optimization window ends.
Step 2: Build a Conversion Lag Table
Let’s use this data as an example to create a conversion lag table.
Credit will be assigned for three periods:
- 0-1 day
- 2-7 day
- 8-28 day
Here’s an example table you can create from your own data:
| Campaign | 1-Day Click | 7-Day Click | 28-Day Click | 0–1 Day | 2–7 Days | 8–28 Days | Total |
|---|---|---|---|---|---|---|---|
| Campaign 1 | 283 | 488 | 648 | 283 | 205 | 160 | 648 |
| Campaign 2 | 65 | 96 | 98 | 65 | 31 | 2 | 98 |
| Campaign 3 | 131 | 174 | 183 | 131 | 43 | 9 | 183 |
From here, you can break it down into percentages by time period by dividing the period by the total.
Example: 283 / 628 = 43.7% of conversions in campaign 1 happen in 0-1 days.
| Campaign | 0–1 Day % | 2–7 Days % | 8–28 Days % |
|---|---|---|---|
| Campaign 1 | 43.7 % | 31.6 % | 24.7 % |
| Campaign 2 | 66.3 % | 31.6 % | 2.0 % |
| Campaign 3 | 71.6 % | 23.5 % | 4.9 % |
This chart helps visualize the amount of credit that will be received in the future to avoid making uninformed decisions too early.
Step 3: Calculate Average Attribution Lag
The last step is finding the average lag – this will tell you on average how long it takes a user to convert.
Use midpoints for each attribution window to find the respective averages.
Midpoints used:
- 1 day = 0.5
- 7 day = 4.5
- 28 day = 18
These are used in a percent calculation to find a weighted average.
Formula: ((1 Day x 0.5) + (7 Day – 1 Day) x 4.5) + ((28 Day – 7 Day) x 18)) / 28 Day
Note: A Meta Ads MCP Server can include a tool that runs these calculations.
Get My Pre-Formatted Worksheet
Calculating these numbers is simple but repetitive. To save time, I built a ready-to-use worksheet — just plug in your 1-, 7-, and 28-day data, and it’ll handle the math automatically.
Download the free template here
Tracking these results over time also reveals how buying behavior changes after creative, offer, or website updates.
Key Considerations and Common Pitfalls
While useful, there are some key considerations to keep in mind when using attribution windows to inform insights.
Meta’s Last-Click Model Skews Reality
By default, Meta attributes conversions to the last click, not the first interaction. This can make lag appear shorter than it really is.
Put simply, if someone engages with an ad, but clicks through a different ad and converts, Meta won’t attribute credit to the ad that initially sparked interest.
Unfortunately, this is a limitation of Meta due to their focus on user privacy and tracking persistence in the browser.
Multi-touch attribution tools that store cookies longer than 7 days can give a more accurate view of the entire journey.
Funnel Stage Effects Attribution Lag
Where a conversion falls in the user journey dictates its attribution lag.
When measuring events like product page views or add to carts, attribution lag will appear shorter (though may still have some valuable insights).
Events like leads or purchases will always have longer attribution lags due to the consideration involved.
Learn what conversions events to optimize for optimal performance across your user journey.
Delayed Conversion Reporting
Meta’s reporting rate can also be delayed. Conversions may take up to 24 hours or more to be reported in Ads Manager.
Because of this, only conduct attribution lag analysis with data that is at least 48 hours old. I recommend looking at data that’s at least a week old for the most accurate analysis.
Track Trends Over Time for Better Insight
While useful to conduct once, this analysis is not something that should only be done one time. Regular monitoring (either monthly or quarterly) can help expose the effect of changes to ad campaigns or website experience.
For example, a shrinking time lag might indicate that creative is more effective or the website flow is easier to navigate.
Add this analysis to your existing reporting for enhanced insights into a more nuanced part of user behavior.
Make Smarter Optimization Decisions
Attribution lag is one of those hidden variables that quietly shapes every campaign’s results. Ignoring it can make great campaigns look like failures, while understanding it reveals how people actually make buying decisions.
By factoring in your average lag before judging performance, you’ll not only make smarter optimization decisions, you’ll forecast more accurately, retarget more effectively, and give campaigns the time they need to work.
In short: attribution lag isn’t a reporting quirk – it’s a window into your customer’s decision cycle. Once you start measuring it, you’ll never look at your Meta Ads performance the same way again.