Why Your TikTok Ads Aren’t Working (You’re Measuring the Wrong Thing)
TikTok Ads gives advertisers the chance to reach people while they’re actively consuming content. More than Facebook or Instagram, it’s where attention actually lives.
The problem is most advertisers quickly assume it’s not working. CPAs look high, ROAS looks low, and performance appears instinctively worse than other channels.
That conclusion overlooks a core detail: TikTok isn’t supposed to close.
Its primary currency is attention. And attention is scarce. This article breaks down why attention matters on TikTok, how to measure it properly, and how to evaluate ads based on their ability to earn the right to scale.
TL;DR
TikTok isn’t a conversion channel – it’s an attention market.
Ads that earn and hold attention get distribution, even if they look inefficient on CPA.
Measuring hook rate, retention, and watch time explains why some creatives scale and others stall. Giving you a pulse check long before conversions show up.
Why TikTok Breaks Conversion-First Measurement
Most advertisers treat TikTok like an other ad channel – using last-click attribution to validate performance. This misses an important piece of information.
TikTok is pre-intent by design. Its users aren’t shopping or browsing, they’re consuming.
It’s the same mistake many advertisers make with YouTube measurement. Conversions are not a reliable measure of performance.
Not because they aren’t measurable – TikTok actually has strong e-commerce measurement – but rather because they are not a great proxy for impact.
Most conversions on the platform are view-through and simply the platform attributing warm traffic or existing customers like Performance Max.
Moreover, engagement on the platform is poor at best. Moving from an engagement and conversion model to attention model isn’t just strategic, it’s necessary.
From Conversions to Attention Economics
Attention isn’t measured like engagement or conversions. There’s no “cost per attention” metric – instead, attention has depth and value.
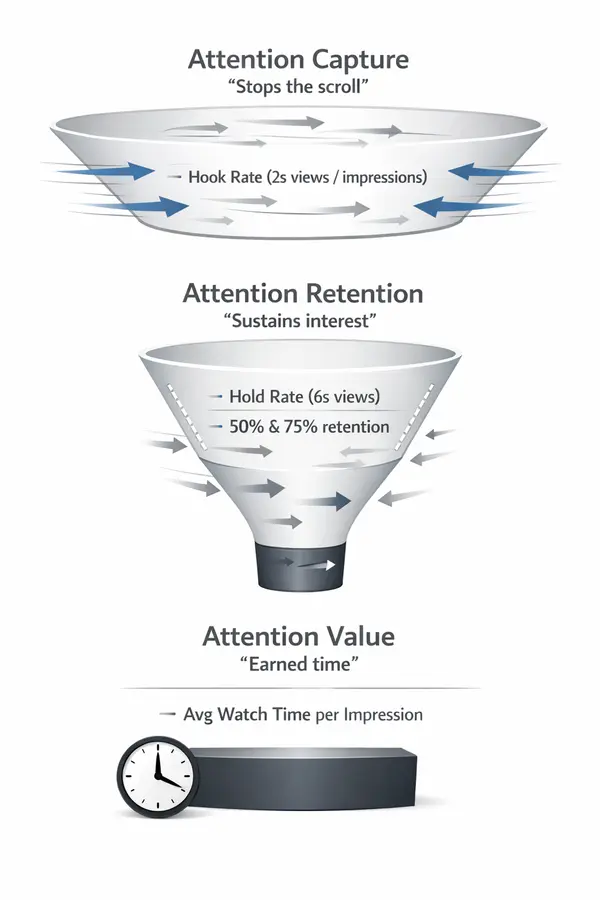
In practice, attention economics breaks down into three components:
- Attention capture – the ability to stop the scroll
- Attention retention – the ability to hold interest
- Attention value – how much attention each impression actually earns
On TikTok, video playback is the clearest proxy for attention. Rather than optimizing for clicks, these signals explain which ads earn distribution and which ones quickly stall.
This framework delivers a consistent way to compare ads against each other and learning what drives the most effective performance.
The Dataset and Approach
To measure each component of attention, I analyzed ad-level TikTok performance data using video engagement signals only, intentionally excluding conversions.
The goal wasn’t to predict sales, but rather understand which ads earned the right to scale.
The analysis focused on native TikTok metrics, including:
- Impressions
- 2-second video views
- 6-second video views
- Video views at 50% and 75%
- Average play time per video view
These signals form the foundation for measuring attention capture, retention, and value.
Measuring Attention: The Metrics That Matter
In effect, each attention economy metrics has a calculated metric that allows for better comparison across ads.
Attention Capture: Hook Rate
Hook rate measures an ad’s ability to stop the scroll.
Hook Rate = 2-second video views / impressions
It’s a powerful early signal across feed-based platforms including Meta’s Andromeda because no message can be retained if it isn’t first noticed.
Attention Retention: Hold and Depth Rates
Retention measures whether curiosity survives beyond the opening frame.
Hold Rate = 6-second video views / impressions
50% and 75% views are additional indicators of retention and signal attention depth. Calculate their hold rates similar to above.
Hold Depth Rate = 50% or 75% video views / impressions
Attention Value: Average Watch Time
Retention shows how long people stay once they start watching. Attention value shows how much attention each ad actually earns.
Average Watch Time quantifies attention in time. Think of it as an investment in brand awareness, message absorption, and future consideration.
Individually, these metrics are informative. Together, they provide a forward-looking view of performance, explaining what’s likely to happen before conversions appear.
Building an Attention Quality Score
Metrics are hard to analyze in isolation. Building a single measure that compares attention quality makes analysis easier.
The attention quality score uses our metric rates from above to form an aggregate rating.
Attention Quality Score = (w1 x Hook Rate) + (w2 x Hold Rate) + (w3 x 50% Hold Rate) + (w4 x 75% Hold Rate)
A key component of this formula are the weights (w1, w2…). These place different priority on each metric.
Weighting Attention Metrics
Since Hook Rate matters the most (no message is consumed without a good hook), it gets the highest weight.
Example Weights:
- w1: 35%
- w2: 25%
- w3: 25%
- w4: 15%
Depth gets weighted similarly with preference for longer watch times because retention compounds value.
The exact weights can be tailored to each campaign or video length, but the structure should stay the same.
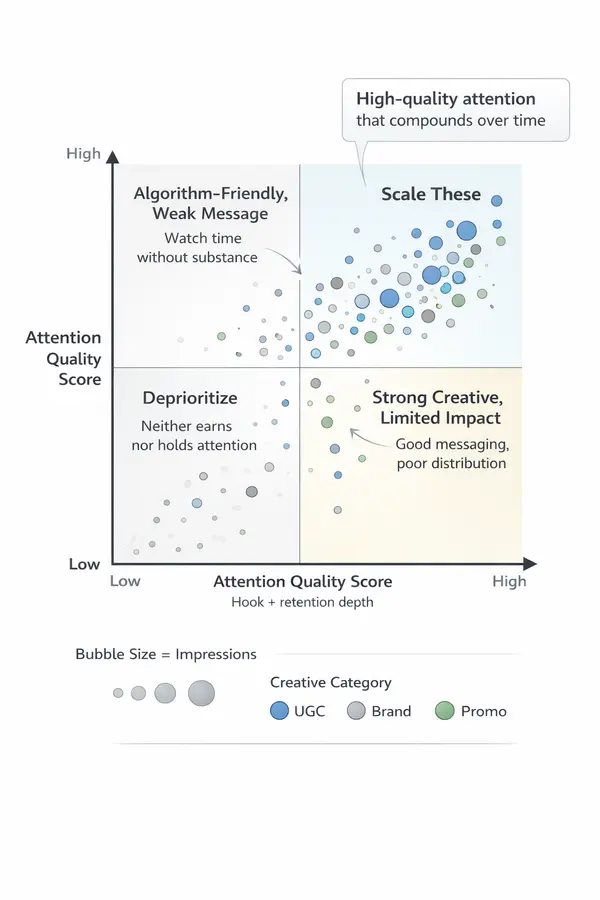
What the Data Shows
Real campaign data shows how attention quality is distributed across ads. There are a few top performers based on their strong hook rates, but these don’t always maintain attention.
| Ad name | Hook Rate | Hold Rate | 50% Hold Rate | 75% Hold Rate | Attention Quality Score |
| Ad 1 | 77% | 23% | 30% | 16% | 43 |
| Ad 2 | 63% | 24% | 6% | 3% | 30 |
| Ad 3 | 46% | 17% | 25% | 13% | 29 |
| Ad 4 | 34% | 0% | 36% | 23% | 24 |
| Ad 5 | 39% | 0% | 31% | 18% | 24 |
| Ad 6 | 45% | 18% | 12% | 6% | 24 |
| Ad 7 | 34% | 0% | 31% | 19% | 23 |
| Ad 8 | 37% | 9% | 19% | 11% | 22 |
| Ad 9 | 42% | 11% | 12% | 6% | 21 |
| Ad 10 | 38% | 0% | 23% | 12% | 21 |
This exposes a key factor that’s overlooked in the Attention Quality Score – attention value.
Building a framework for attention value is straightforward thanks to TikTok’s built in video watch time metric.
From Quality to Value: Why Watch Time per Impression Matters
The quality score misses a key point: what if videos are different lengths.
A 6s video will have an identical 50% hold rate as hook rate. This can skew results making shorter video lengths appear better.
Assigning a value to attention solves this.
Attention Value Score = Attention Quality Score x Avg Play Time per Impression
Now instead of simply rewarding videos that gain attention, also favor total interaction. The theory is simple: the more time spent on an ad, the more influence it will have on a person’s awareness, consideration, etc.
What the Data Shows
Let’s take a look at that same data but now with attention value.
| Ad name | Average play time per video view | Hook Rate | Hold Rate | 50% Hold Rate | 75% Hold Rate | Attention Quality Score | Attention Value Score |
| Ad 1 | 4.55 | 77% | 23% | 30% | 16% | 43 | 194 |
| Ad 2 | 6 | 63% | 24% | 6% | 3% | 30 | 182 |
| Ad 3 | 3.66 | 46% | 17% | 25% | 13% | 29 | 105 |
| Ad 4 | 2.57 | 34% | 0% | 36% | 23% | 24 | 63 |
| Ad 5 | 2.76 | 39% | 0% | 31% | 18% | 24 | 67 |
| Ad 6 | 3.92 | 45% | 18% | 12% | 6% | 24 | 94 |
| Ad 7 | 2.46 | 34% | 0% | 31% | 19% | 23 | 56 |
| Ad 8 | 3 | 37% | 9% | 19% | 11% | 22 | 65 |
| Ad 9 | 3.36 | 42% | 11% | 12% | 6% | 21 | 72 |
| Ad 10 | 2.71 | 38% | 0% | 23% | 12% | 21 | 56 |
Despite having a low hold depth rate, Ad 2 is one of the top performers. In this case, longer video length did not lead to lower attention value.
Understanding these metrics provides a framework for analysis, but still requires critical thinking when deciding how to optimize creative messaging.
What Actually Earns Attention on TikTok
This framework hopefully aims to turn insight into action. Answer questions like:
- What messages earn the most attention value
- Are certain creative topics performing well
- Which collapsed after the hook
To make analysis even easier, group ads by category or topic. Set up the attention metrics the same way and see how your ad concepts compare to each other.
Looking at data from a different advertiser shows how topic level performance shifts analysis.
| Ad name | Hook Rate | Hold Rate | 50% Hold Rate | 75% Hold Rate | Average Watch Time | Attention Quality Score | Attention Value Score |
| Brand | 20.2% | 2.7% | 10.2% | 5.0% | 1.60 | 4.06 | 6.48 |
| Influencer | 25.6% | 6.8% | 1.2% | 0.6% | 2.66 | 2.18 | 5.79 |
| Product-Led | 10.9% | 2.4% | 1.1% | 0.8% | 1.50 | 1.03 | 1.54 |
| Promo | 11.8% | 0.6% | 7.1% | 3.5% | 1.40 | 2.48 | 3.49 |
| UGC | 18.9% | 3.5% | 9.0% | 4.9% | 1.82 | 3.94 | 7.16 |
Why UGC and Influencer Content Perform Better
TikTok Ads work well when they’re made to look as organic as possible – content on the platform is low production quality and users are instinctively looking for that.
That’s why UGC and Influencer videos routinely capture attention better. Brand-led videos with short lengths also drove higher attention, though mainly due to watch-through.
Seeing analysis at this level is the catalyst for change.
How Attention-Based Analysis Changes Optimization
Ad analysis is challenging, especially without clear conversion metrics. It’s often unclear why some ads “randomly” scale or why others look inefficient early, especially when conversion lag is ignored.
A framework like attention economics makes it possible to analyze performance systematically – providing both a leading indicator and a consistent way to compare ad concepts.
Think of TikTok like a feeder campaign – conversion performance won’t look great compared to Google or Meta, but it can drive valuable awareness and consideration when done right.
Expanding the Measurement Framework Beyond TikTok
Building an effective measurement framework for TikTok Ads requires going beyond in-platform metrics. To understand how TikTok impacts other channels, additional analysis must be done outside of the ad channel.
Running matched market testing is a great way to start quantifying the impact of TikTok Ads on top line sales.
Additional metrics that give directional insight into impact are:
- Brand search volume
- Downstream Meta/Search efficiency
- Retargeting pool quality
From Platforms to Systems
TikTok isn’t hard to make work – it’s hard to measure honestly.
Most performance issues on the platform don’t come from creative failure. They come from evaluation frameworks that were built for channels designed to capture demand, not create it. When TikTok is judged on CPA or ROAS in isolation, it will almost always look inefficient — especially early.
Shifting to attention measurement tells a different story.
Breaking performance down into attention capture, retention, and value explains why certain ads scale, why others stall, and why longer-form or less “efficient-looking” creatives often deliver more influence over time. These signals don’t replace conversions, but rather precede them.
Shifting from platform-level metrics to systems-level thinking and measuring attention honestly is the real unlock. When you do, TikTok stops looking random and starts looking predictable. And predictable is scalable.