
When (and When Not) to Automate Marketing Reporting
Automation plays an important role in modern marketing workflows as an efficiency lever, often used for repeatable tasks that need to be done regularly.
However, the word has evolved into a buzzword with more praise than it’s worth.
The key is knowing when to automate, and when to continue doing work manually. Setting up a clear process for how and when automation is applied is often the difference between intermediate and advanced marketers.
This article breaks down common pitfalls with automation, explores which reporting processes actually benefit from it, and builds a mental model for how to approach reporting automation intentionally.
If you want to see how this philosophy translates into a real system, I also walk through how I automate weekly marketing reporting in practice.
TL;DR
- Automation doesn’t fix reporting problems. It scales existing structure.
- If you can’t write the report manually, you shouldn’t automate it.
- The best automation removes friction from data collection, not judgment from analysis.
- Dashboards fail when they automate outputs without clarifying decisions.
- Good automation preserves flexibility, supports human interpretation, and follows decision cadence.
Why Reporting Automation is Usually Done Too Early
Automation is appealing because it promises leverage: set it up once, save hours every week. When it works, it feels like progress.
The problem is that automation doesn’t remove complexity. It amplifies whatever structure already exists.
Without clear definitions, constraints, and intent, automated reporting scales confusion faster than it saves time.
This is why dashboards so often disappoint. They automate outputs without clarifying decisions. Visualizations refresh on schedule, metrics update automatically, but no one is more confident about what the numbers mean or what should happen next.
The issue isn’t automation itself. It’s that automation is often applied before the reporting system is designed. Static metrics get refreshed more frequently, noise moves faster, and teams mistake activity for insight.
Automation done too early doesn’t simplify reporting. It simply hardens bad assumptions into the system.
What Must Be True Before You Automate Anything
No amount of automation makes up a lack of structure. If you can’t write the report manually, automation will only make the problem harder to see. Tools can scale a process, but they can’t create judgment.
The first requirement is a clear weekly reporting structure that emphasizes trends over time and maintains historical context. Reporting needs a stable cadence, consistent definitions, and an agreed-upon sequence for interpreting results.
In some businesses, especially those with long consideration cycles, weekly reporting may not be the right resolution. Monthly reporting may better reflect how the system actually responds. Automation should follow reality, not force it.
Finally, reporting must be insight-driven, not metric-driven. The report should connect performance back to strategy and be interpretable by anyone on the team, not just the person who built it.
Only once these conditions are true does automation become leverage instead of liability.
A Mental Model for Reporting Automation
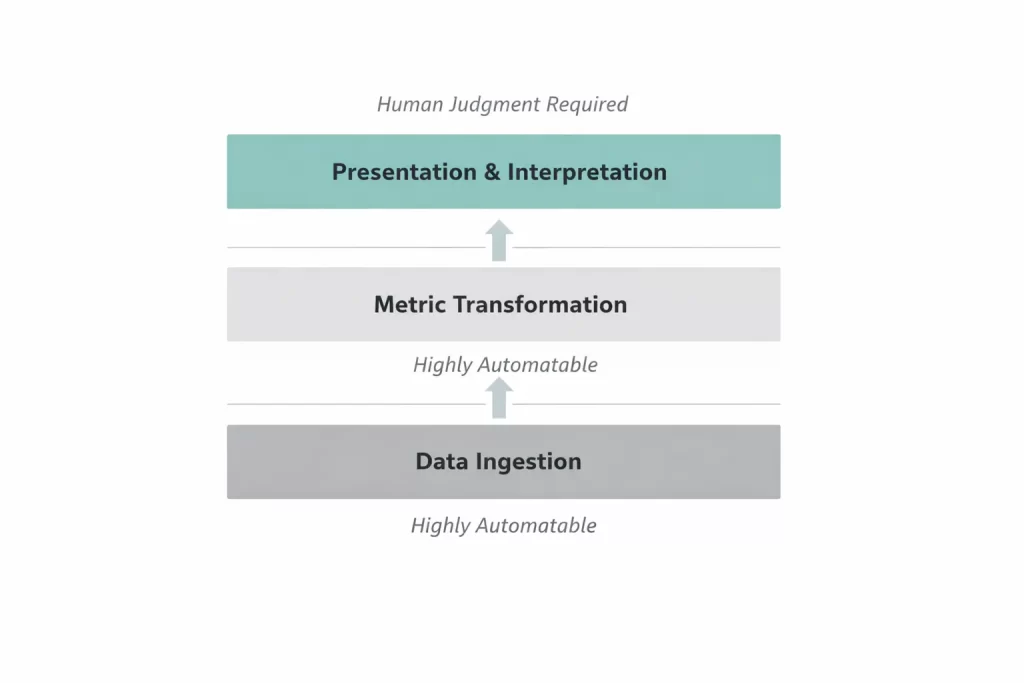
Marketing reporting follows three core tenets, layers that make up the process. Each step has it’s own opportunity with automation.
This same layered logic applies to campaign management as well. I break down how automation fits across execution, optimization, and strategic direction in my guide to campaign management automation.
Data Ingestion
To prepare each report, data is pulled from platforms usually into a database or sheet. This process is the most straightforward because once the export is set up once, it’s reusable forever.
Automation is an excellent candidate for this stage of the process thanks to it’s highly repeatable nature.
Metric Transformation
Data for different platforms often comes formatted differently, using varied naming conventions for metrics or objectives. To compare cross-channel performance cleanly, metrics need to be aggregated under standardized labels.
Again, automation excels at this stage of the process because of the focus on rule sets.
Presentation
Crafting a narrative with data is the most nuanced part of the reporting process. It requires context and consideration of external factors, and still won’t always be clear.
Putting together an analysis and path forward require consideration of more than just data. Often times, stakeholders and strategic focus are more important than just what the data says.
For those reasons, this process doesn’t benefit from automation.
Where Tools Fit Into The Reporting Workflow
Reporting automation isn’t about choosing the right tool – it’s about understanding which layer of the system a tool belongs to.
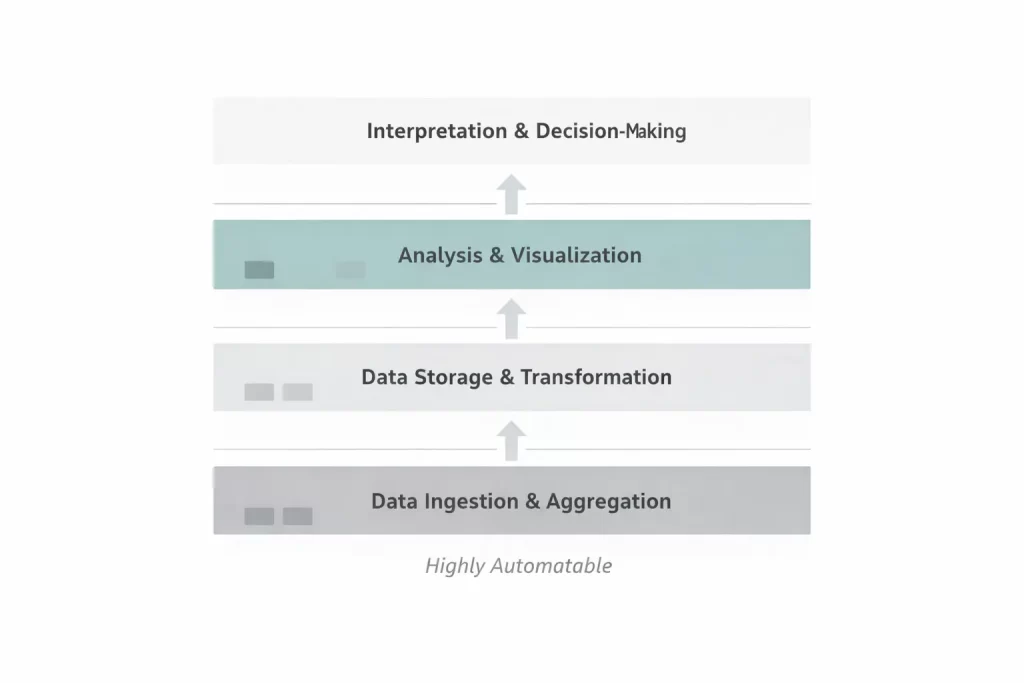
Most reporting stacks are made up of the same four layers, regardless of company size or complexity. The difference between clean automation and chaos isn’t the tools themselves, but whether each layer has a clear purpose.
Those layers are:
- Data ingestion and aggregation
- Data storage and transformation
- Analysis and visualization
- Interpretation and decision-making
Tools don’t replace thinking at any of these layers. They simply reduce friction where structure already exists.
Spreadsheets: The Thinking Layer
Spreadsheets are often dismissed as “basic,” but they play an important role early in reporting maturity.
They’re low-cost, flexible, and accessible. More importantly, they force structure. When reporting lives in a spreadsheet, definitions are visible, assumptions are explicit, and trends are easier to reason about.
Spreadsheets can technically handle every part of the reporting process: data downloads, calculations, and visualization, but at the cost of manual effort. As scale increases, that effort becomes the bottleneck.
This is where automation should begin. Not with dashboards, but with reducing manual data movement.
Data Aggregation
The first part of reporting that should be automated is data collection.
Data aggregation tools exist to reliably pull data out of platforms, standardize fields, and refresh it on a consistent schedule. Tools like Supermetrics or Funnel.io sit squarely in this layer.
Their job isn’t to make reports better – it’s to make data movement seamless.
Once data is aggregated, it can flow into spreadsheets or warehouses with consistent definitions and historical continuity. This is where automation starts to create leverage.
The tradeoff is cost and complexity. Aggregation tools introduce recurring fees and require upfront setup. If reporting structure isn’t already clear, they often amplify confusion instead of reducing work.
Warehouses
Warehouses exist to solve problems of scale.
As data volume grows, spreadsheets become brittle. Warehouses like BigQuery, Snowflake, or Azure provide durable reminders of history, support complex transformations, and allow metrics to be defined once and reused consistently.
Warehouses are powerful, but they also raise the technical bar. Custom metrics require SQL, transformation logic must be maintained, and costs scale with usage.
For teams ready to move beyond spreadsheet-based aggregation, I’ve documented how to build a fully automated reporting pipeline using Fivetran as the ingestion layer.
BI Tools
BI tools sit at the presentation layer.
Their role is to visualize trends, surface patterns, and support interpretation – not dictate action. When BI tools are used without a strong reporting framework, they tend to prioritize freshness over clarity.
Connecting a BI tool to automated data doesn’t create insight on its own. It simply makes the same questions appear faster.
Good reporting systems treat BI tools as ways to answer recurring questions, not independent from analyst insight.
What Good Automation Looks Like
While good reporting automation looks different depending on business size and complexity, the underlying principles stay the same.
At a minimum, automation should ensure that weekly data from priority systems (CRM, ad platforms, revenue systems) refreshes reliably into a fixed structure. That structure should be easy to pivot, review, and pull into other tools as needed.
Just as important, automation should preserve room for human judgment. The goal isn’t to eliminate analysis. It’s to remove repetitive data work so analysts can focus on interpretation and decision-making.
Good automation reduces friction without removing flexibility.
Common Automation Failures
Most automation failures don’t come from technical issues. They come from breaking the decision-making process.
Refreshing data too frequently is a common example. Daily refreshes can be useful, but in systems with meaningful lag they often create alert fatigue and encourage overreaction.
Another failure mode is building tools for “stakeholders” instead of owners. Reports without clear ownership tend to go unused, regardless of how polished they are.
Finally, automation often fails when data cadence doesn’t match decision cadence. If a metric is only reviewed weekly, automating it to refresh daily adds noise without value.
Automation should follow how decisions are actually made.
How Automation Changes the Role of the Marketer
When done well, automation shifts marketing work upstream.
Instead of spending time pulling reports and cleaning data, analysts spend more time diagnosing systems, identifying patterns, and connecting performance back to strategy.
This shift benefits leadership as well. Better analysis leads to more proactive decisions and fewer reactive ones. Conversations move from “what happened?” to “what does this tell us to do next?”
Automation doesn’t replace strategy – it creates space for it.
When to Delay Automation of Purpose
Automation only works once a reporting model is stable.
Before automating anything, core KPIs, reporting cadence, and interpretation frameworks need to be established manually. If those elements are still changing, automation adds overhead instead of leverage.
This is especially true for new channels, new tests, or new strategies. Early-stage experimentation benefits from flexibility, not locked-in processes.
Automation often takes more time to set up than expected. Its payoff comes weeks or months later. Automating too early usually means rebuilding systems that weren’t ready to scale.
In reporting, restraint is often the faster path.
Automation Scales Intentional Reporting
The purpose of automation is not to replace reporting, but rather streamline it and the work of analysts whose job it is to create a narrative from data.
Understanding where automation fits at each stage of the reporting process is fundamental to building efficient systems. The goal isn’t faster dashboards or more frequent updates – it’s clearer insight with less friction.
Structure and automation go hand in hand. Data moves reliably, trends stay visible, and analysts spend less time cleaning inputs and more time explaining what the system is doing and why.
Good reporting still requires judgment. Automation should make that judgment easier to apply, not easier to avoid.
If you’re ready to move from spreadsheet automation to a warehouse-backed system, here’s how to set up automated paid media reporting with Fivetran step by step.
Related Reading
For readers interested in strengthening data inputs and infrastructure: