
Incrementality Testing: How to Measure What Marketing Actually Works
One question that comes up more often in marketing than I would care to admit is “How do we know it’s working”. It’s a question that’s existed as long as marketing and one that a multi-billion dollar attribution industry is built around.
Fancy tools like multi-touch attribution platforms can give insight into what advertising channels drive conversions like leads or sales. We’ve even discussed ways to use UTMs to track the first-click source of website visitors.
The catch: Every ad platform has a vested interest in claiming credit for conversions. Google wants to prove it works. So does Meta. So does every ad platform that exists.
Each platform optimizes their attribution model to make their channel look as effective as possible (think Performance Max) to win a larger share of advertisers’ budgets.
The reality: Attribution is far from perfect. According to Harvard Business Review research, fundamental changes to the digital ads ecosystem—such as Apple’s new tracking limits—mean that traditional user-level measurement is becoming increasingly challenging, making alternative measurement more important than ever.
Marketers face additional challenges like offline (hard-to-track) environments, imperfect controls that demand stronger baselines, and long buying cycles. Enter incrementality testing – an experimental method aimed at proving marketing’s true contribution. Let’s dive into the basics and look at some examples.
TL;DR
The Problem: Every ad platform claims credit for the same conversions, making it impossible to know which marketing actually drives incremental results.
The Solution: Incrementality testing isolates marketing’s true contribution by comparing test markets (with ads) vs. control markets (without ads).
Key Finding: Our case study showed Meta + Google Ads drove 13% incremental sales lift vs. Google alone (2.2%) – insights impossible to discover through traditional attribution.
Bottom Line: Attribution tells you where conversions come from; incrementality testing tells you whether they would have happened anyway. Use attribution for optimization, incrementality for strategy.
What is Incrementality: The Nike vs. Hoka Example
Consider two shoppers looking to buy a new pair of shoes.
One starts their journey by visiting Google and searching for ‘red shoes’. They’re served several ads from top manufacturers like Nike, Adidas, and New Balance. After considering several options, they make a decision to buy Nike’s.
Another hears about a brand called Hoka from a friend. They follow a similar suit in searching ‘Hoka shoes’ on Google. Several ads pop up – Hoka, Nike, and New Balance. Knowing that they want Hoka shoes, they click on that ad and make their purchase.
The difference between these scenarios is that the person buying Hoka’s didn’t actually purchase because of the ad – they were already decided when their friend gave them a rave review.
Conversely, the other person who bought Nike’s came to their decision because of Nike’s ad was at the top of the page. This is the difference between an incremental purchase and not.
Why Incrementality Testing Matters
In short, incrementality testing provides the framework for understanding how to strategize marketing efforts rather than simply basing budget allocation and resource distribution on assumption.
As digital analytics expert Avinash Kaushik notes, if your company uses more than one marketing channel, incrementality testing is “the only way to measure results accurately”.
The $30K Attribution Overlap Problem
Take for example the following media plan:
- Google: $10k
- Meta: $10k
- Programmatic Display: $10k
Looking at campaign performance you see positive results, but notice an alarming finding in your backend. How did 3000 conversions turn into 1000 sales? Herein lies the problem with attribution.
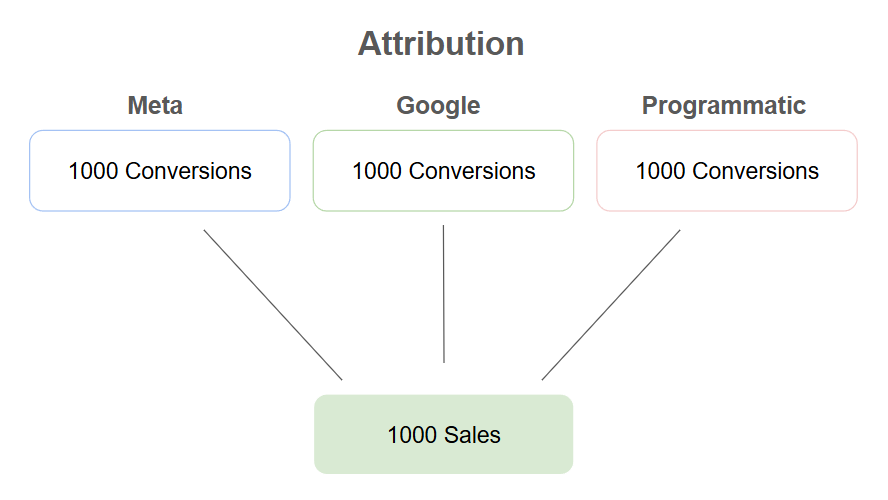
Turns out your ~$3 cost per sale is actually 3x higher. This raises a fundamental question: what is actually working? Maybe real credit looks like this:
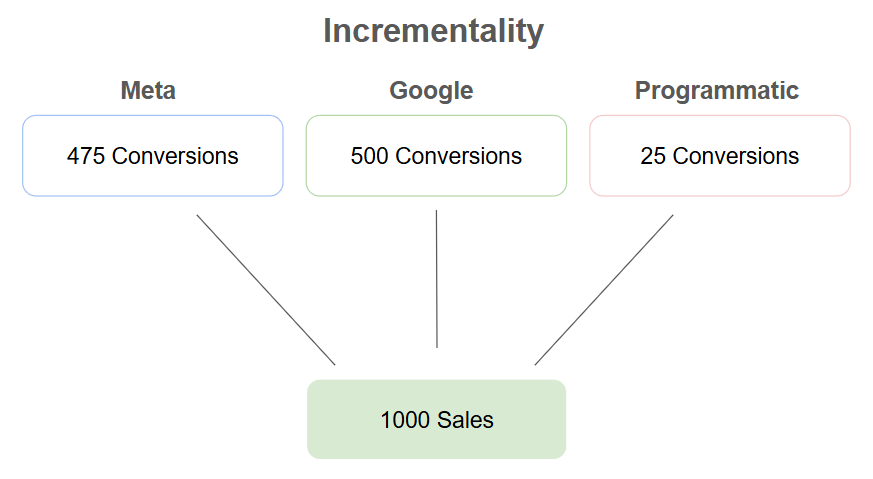
Maybe you wouldn’t lose any sales. Incrementality testing offers a way to test this.
Note: Media Mix Modeling also offers a way to better understand channel incrementality without controlled experiments.
Types of Incrementality Tests
There are several ways to conduct incrementality testing, but all involve the manipulation of marketing spend in isolated test vs control environments. Two of the most common ways are:
Hold-out Tests
Hold-out tests are the simplest form of incrementality test. Assuming advertising is running across a country (or city for local advertisers), hold-out markets are ares that are excluded from targeting.
This could be a state(s) or zip codes depending on what geographic regions are targeted.
Results are measured as pre-test and post-test, in both the national targeted campaigns and the regions being excluded from targeting.
Pre-test measures show what impact the hold-out test had on performance within the market, though can be susceptible to external factors like seasonality.
Post-test measures are compared between the hold-out market and the other markets included in targeting. This gives a more reliable measure of marketing activity impact as it eliminates the confounds like seasonality or market trends.
Virtually any metric can be used to measure the difference, but some primary metrics to consider are:
- Brand Lift
- Any conversions (purchases, leads, etc.)
- Business Metrics (sales, revenue, etc.)
This simple test structure allows for an easy way to test the incrementality of all marketing efforts. However, if you need to understand which specific channels or tactics are driving incremental results, you’ll need a more sophisticated approach.
Matched market tests are a slightly more challenging but effective way to measure the impact of individual marketing efforts.
Matched Market Tests
Matched market tests involve testing a change in marketing strategy in at least one market and measuring it against a control (where no changes are made).
Similar to a hold-out test, a test market could be any geographic region down to a zip code or up to a state/country.
Unlike a hold-out where the change is pausing media, the change here is additive. Changes could include:
- Testing a new marketing channel
- Launching a new campaign
- Testing new ad creative
Additionally, matched markets must be as similar to each other in terms of characteristics as possible.
The key to matched market testing is controlling variables between the test and control market. These variables could include:
- Business performance (sales, revenue)
- Population (in-market)
- Audience characteristics
- Store locations
- Campaign performance
- Search Volume (for Search tests)
Controlling for these will give the test the best chance at success. In addition, forecasting results ensures you’re not mistaking normal performance swings for incremental lift
To illustrate how matched market testing works in practice, let’s examine a real-world study we conducted for a retail client.
Case Study: Google Ads vs. Meta Ads Incrementality Test
A client running Google and Meta Ads nationally wanted to learn what was actually driving sales. We devised a test to run Google Ads and Meta Ads in separate markets aimed at driving incremental conversions and incremental sales.
Test Methodology
Two test markets and one control market were chosen with the following setup:
- Test Market 1: Google Ads only
- Test Market 2: Google Ads + Meta Ads
- Control: No additional media
The test aimed to answer two hypotheses:
- Running Google Ads will drive incremental conversion and sales volume.
- Adding Meta Ads will drive a greater increase in incremental conversion and sales volume.
The tests were set to run over a 3-month time period.
Controlling for Variables
To control potential confounding variables, we paid special attention to maintain consistency between the two test and one control markets.
The tests were set up to have matching:
- Historical sales
- Audience targeting (in-market)
- Ad messaging
- Ad budgeting
The primary concern with running Google Ads in both markets was any difference in tactical execution. We mitigated this through a master keyword list and matching Youtube ad creative.
In addition to this, budget distribution between search (Brand vs Non-Brand) and video (Youtube) were kept the same between both test markets to ensure similar acquisition quality.
Measuring Results
Three distinct periods of time were analyzed to establish a baseline, measure immediate impact, and allow for a considerable amount of conversion lag time.
- Benchmark: 3-month period prior to the running the test
- Testing: 3-month period during the test
- Post-Test: 6-month period following the test
Since the post-test period was longer than both benchmark and testing phases, we couldn’t measure the total volume during each phase. Instead, we used the monthly average during each phase to build lift calculations.
Two key measurements were calculated:
- Benchmark > Testing Lift (Conversions)
- Testing > Post-Test Lift (Sales)
These helped determine what impact the test campaigns had on conversions in-market and ultimately their impact on sales.
To measure benchmark > testing, the follow formula was used to arrive at a percentage of lift.
Conversion Lift = ((Avg Testing Conversions – Avg Benchmark Conversions) / Avg Benchmark Conversions) * 100
A similar formula was used to measure lift in sales:
Sales Lift = ((Avg Post-Test Sales – Avg Testing Sales) / Avg Testing Sales) * 100
These formulas were conducted for each market to determine what lift was seen in the control market to compare to the test markets.
Ultimately, incremental lift is measured as test market lift less control market lift. From there it’s possible to calculate key metrics like incremental conversions and incremental sales.
Analysis and Findings
After the post-test period concluded, results were analyzed to determine whether hypotheses were proven true.
- Hypothesis 1: Running Google Ads will drive incremental conversion and sales volume.
- Hypothesis 2: Adding Meta Ads will drive a greater increase in incremental conversion and sales volume.
Both hypotheses were validated, with some key insights emerging from the data:
| Metric | Control | Test Market 1 (Google Only) | Test Market 2 (Google + Meta) |
|---|---|---|---|
| Conversion Growth | -7% | 0% | 23% |
| Sales Growth | 8.5% | 10.7% | 21.5% |
| Conversion Lift | – | 7% | 30% |
| Sales Lift | – | 2.2% | 13% |
Key Findings:
The market running Meta Ads in combination with Google Ads delivered significantly higher incremental impact – 13% sales lift compared to Google’s 2.2% alone.
Notably, the relationship between conversion lift and sales growth wasn’t perfectly linear due to the lag time between initial conversion and final purchase. However, the substantial incremental gains in both metrics when Meta was present provided clear justification for scaling that combined strategy.
Study Limitations and Considerations
While this study successfully demonstrated incremental lift, several variables could not be perfectly controlled:
Market Size Differences:
- Test Market 2 had roughly 2x the population of Test Market 1
- Higher population density resulted in more store locations and greater search volume
- Larger audience size naturally creates more conversion opportunities
Impact on Results: These factors likely contributed to the performance differences between markets. However, the core finding remains valid: both markets showed clear incrementality when advertising was introduced, with the Google + Meta combination consistently outperforming Google alone.
Implications for Future Testing: The results suggest that social media advertising may be particularly valuable in smaller markets where search volume is limited. Testing this hypothesis through city-level or DMA-specific studies could provide more granular insights while requiring smaller budgets to achieve statistical significance.
For maximum reliability, future studies should prioritize markets of similar size and characteristics, or test across multiple markets within each test group to account for these variables.
How to Implement Incrementality Testing
Matched market tests and proving incrementality in general takes careful consideration of many variables as stated above. Keep these in mind while planning a test.
Budget Requirements
How much can you spend on the test?
Spending only a couple thousand dollars might not produce significant results. To mitigate this, try focusing on smaller markets with smaller audience sizes.
Market Selection
How many different markets are included in your test?
Testing 2 markets like the above example limits the amount of comparison data. To prove statistical significance, it’s much more effective to test several markets in each test category – for example, several cities per test group.
For even smarter tests, try using a synthetic control to compare to your test markets.
Historical Data Needs
How much past performance data do you have to consider?
Knowing what seasonal trends effect business performance can be extremely important in understanding overall impact. At the very least, have year over year performance data to tease out any effects of seasonality on test results.
When to Use Incrementality vs. Attribution
Traditional attribution models tell us where our conversions come from, but incrementality testing reveals something far more valuable: whether our marketing actually matters.
The case study above demonstrates this perfectly. What appeared to be effective marketing campaigns through traditional attribution actually showed vastly different incremental impacts when properly tested.
Meta Ads drove 13% incremental sales lift compared to Google Ads’ 2.2% – insights that would be impossible to discover through attribution alone.
When to Use Each Approach
- Use attribution for optimization: understanding customer journeys, optimizing creative, and tactical campaign management
- Use incrementality testing for strategy: budget allocation, channel mix decisions, and proving marketing’s business impact
Keep in mind, incrementality testing isn’t suitable for every situation. It requires careful planning, significant time investment, and a budget that is able to drive significant results in the markets chosen.
When attribution data is limited, try a Media Opportunity Index using at least 1 year of historical data to analyze market performance.
The key to success lays in the foundation. Start small, focus on one channel, plan for long term analysis, and invest time in measuring both online and offline activity.
If you’re ready to explore incrementality testing, media mix modeling is an equally insightful endeavor that goes hand in hand with parameter controls of matched market testing.