
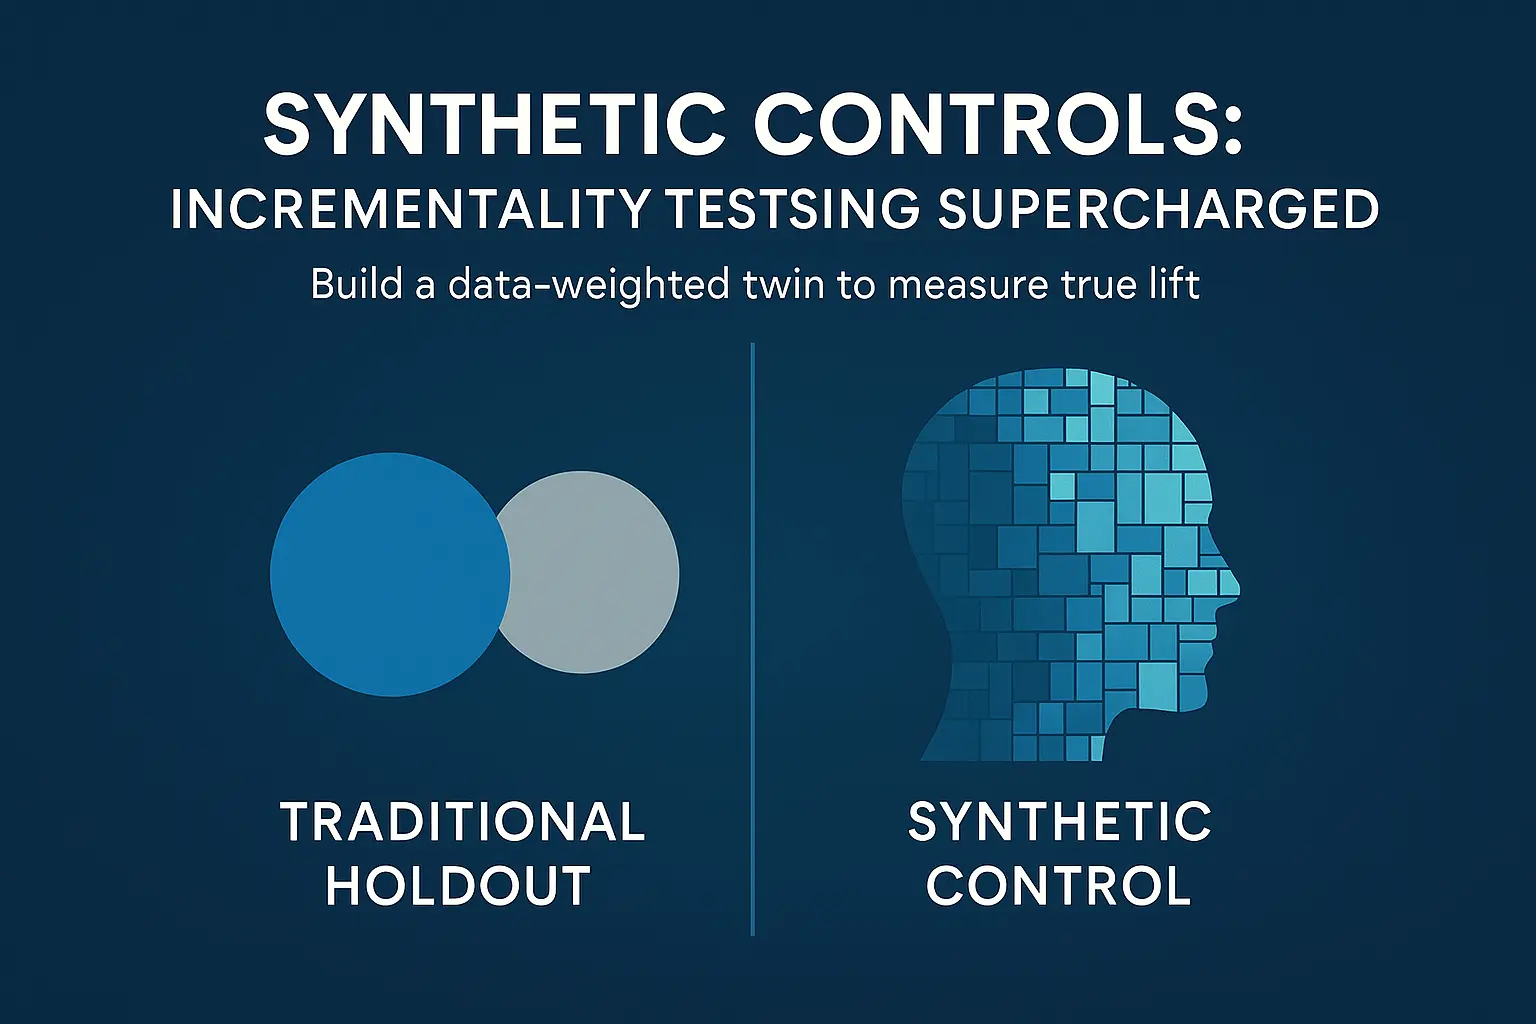
Synthetic Controls: Incrementality Testing Supercharged
Most marketing tests compare a treated group to a control and call it a day. The problem: real audiences aren’t twins—markets differ on dozens of hidden factors that bias results. This is why a lot of marketing incrementality tests fail.
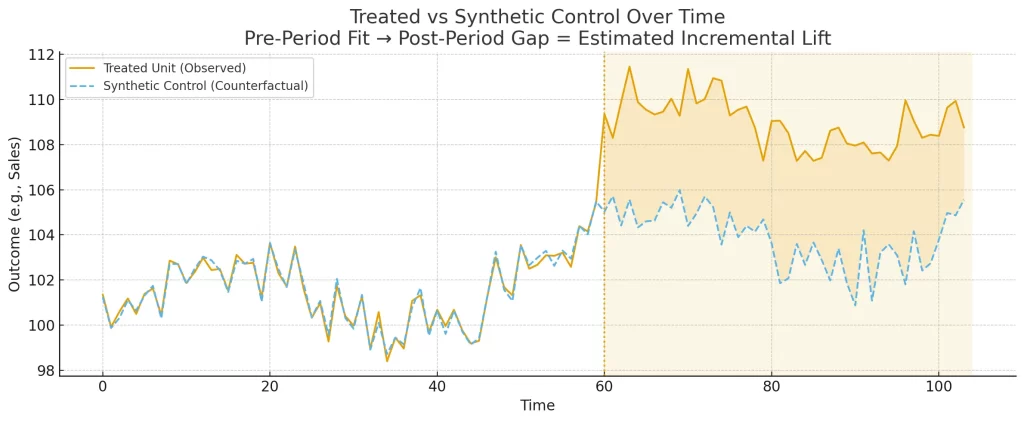
Synthetic controls fix this by building a data-weighted twin of your test group from multiple untreated markets that closely matches pre-test behavior and context. In simple terms, it builds more variability into your audience by combining weighting different markets.
After the campaign, the gap between your results and that synthetic twin is true incremental lift—no clean holdouts required (think national TV, retail pushes, always-on programs).
This article shows how the method works, what data you need, and a simple way to get started—then steps up to Augmented Synthetic Control when you want extra rigor.
TL;DR
Synthetic controls build a data-driven twin of your test group by weighting multiple untreated markets to closely match pre-test behavior and key context.
After the campaign, the gap between treated outcomes and the synthetic twin is your incremental lift. It works even when A/B or clean holdouts aren’t possible (e.g., national TV).
Traditional Control Groups
To better understand the distinct advantage synthetic controls provide, it helps to understand how they compare to traditional controls.
There are two types of control audiences that get used frequently in marketing testing:
- Randomized Control
- Holdout Control
Randomized User-Level Holdouts
Randomized controls eliminate bias through by removing manual selection. The idea being that audiences chosen at random will have relatively similar characteristics. These are most popular for in-market tests (ads, creatives, landing pages) as it’s easy to split the audience into two groups.
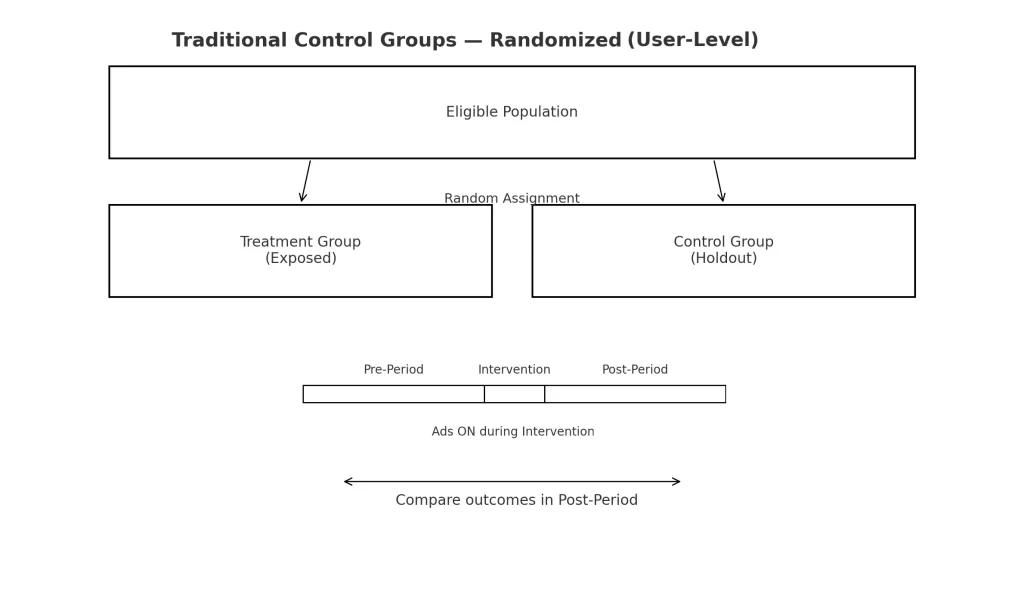
Bonus Tip: Learn how to create randomized controls in Google Analytics using a browser cookie.
Geo/Market Holdouts
Holdout controls are simply an audience that does not receive test treatment. Most often, these are a specific market (DMA, State, Store Location) and are used to judge the effect of marketing vs no marketing. All-or-nothing.
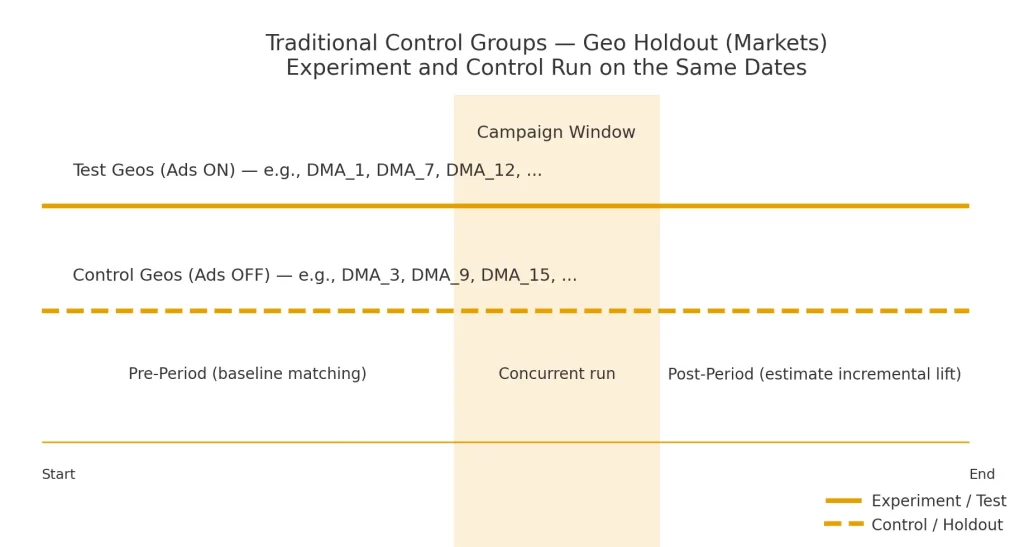
These are more popular for incrementality testing because they can show real cause/effect.
Where Traditional Controls Fall Short
While useful in various scenarios, traditional controls are subject to selection biases that may skew the results.
While randomized audiences are in theory unbiased, audience split could include higher engagers in one audience, or more individuals from a certain demographic or region.
Holdout controls are arguably more flawed. No two markets have the same make-up when there are so many factors involved. Behavioral, demographic, engagement can all be controlled, but external factors like weather, market, or holiday factors add further complexity.
Most failures come from confusing correlation with causation — which is why incrementality belongs inside measurement, not just experimentation.
It’s also essential to have a good grasp on expected outcomes in any split market tests. My ad performance forecasting guide shows how to create that baseline before you start testing.
What Are Synthetic Controls (and Why They Work)
Synthetic controls are an incrementality method that estimates lift by constructing a counterfactual from weighted donor markets rather than relying on a single holdout.
They do this through a combination of:
- Various audiences not included in the test
- Extensive pre-test & post-test data (for both control and test audiences)
An algorithm weights each control segment based on the pre-test data to find an optimal mix of audiences to match the test audience.
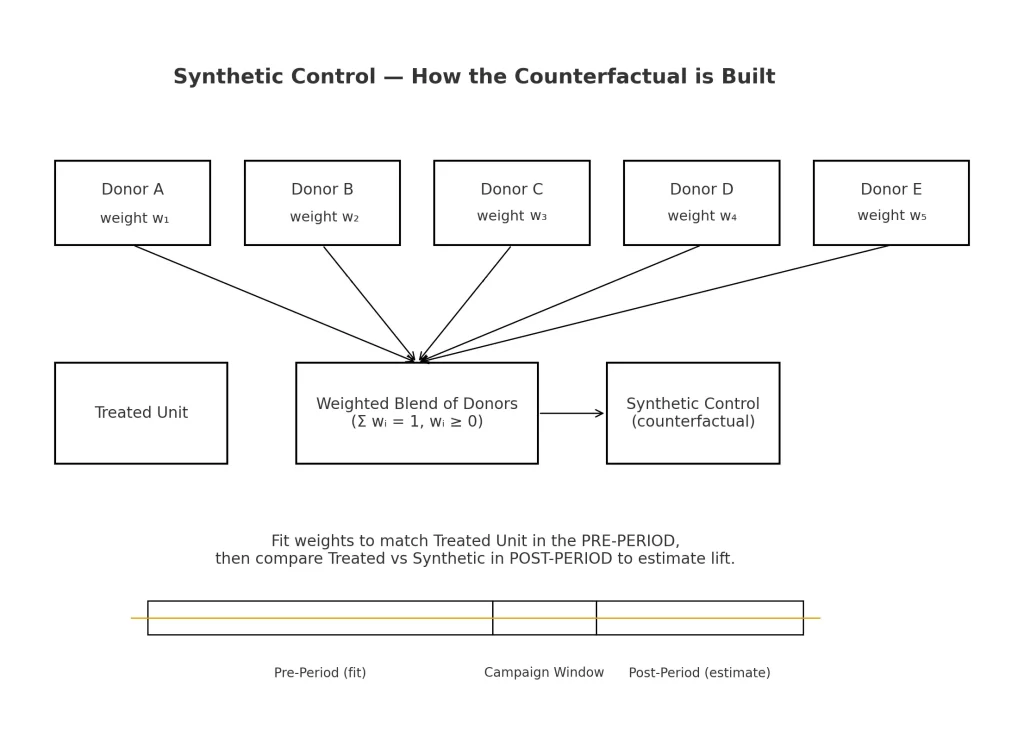
This means that a percentage of each market will be chosen to minimize the variability of one market skewing results.
Building a Synthetic Control (Simple Example)
Ultimately, a synthetic control combines various markets to equal as closely the test market or treatment group.
The key is using a weight equal to a percentage of the markets total volume. For example, let’s pretend I have a test running in Arizona.
To get a synthetic control for the population of Arizona, I use Colorado, New Mexico, California, Nevada, and Texas as donors for my control (being the most similar in geography).
Let’s assume I’m only trying to match them on population. Arizona’s population is 7,582,384.
To get this from the other 5 states I would need to take a percentage like so:
- California: 39,431,263 → 3.05%
- Texas: 31,290,831 → 7.53%
- Colorado: 5,957,493 → 49.42%
- Nevada: 3,267,467 → 20.00%
- New Mexico: 2,130,256 → 20.00%
Source: US Census Data (July 1, 2024)
Like in the image above, the weighted average of all 5 control donors equals 100%. In practice, you’d complete this process for a KPI chosen and optional factors like population, search volume, purchase behavior, etc.
Choosing the Right KPI
Building a synthetic control relies on a key performance indicator (KPI) – most often the metrics you want to improve by running the test.
This could include anything from site engagement to ad conversions to leads, but typically will culminate in sales/revenue as these are the primary drivers of business success.
Test and control audiences are built using this KPI – aiming for similar pre-test performance.
Post-test measurement is used to determine what (if any) lift was seen between the control and test groups.
Post-Test Use Cases (When A/B Isn’t Possible)
Unlike traditional control methods, synthetic controls are created using pre-test data from various markets/user populations.
For this reason, synthetic controls can actually be created after the test has been run. Consider the following:
A national advertising campaign is run over the period of a year – there is no “holdout” market but there is variability in ad delivery across the nation.
A synthetic control would consist of the low exposure areas compared to the high exposure areas – looking to match up KPI performance during the pre-test period.
This effectively creates an incrementality test without excluding markets from advertising.
Advanced Variants
While looking at a key metrics like sales, revenue, or orders is key to understanding how to grow a business, market factors play an important role in the success (or failure) of marketing campaigns.
Therefore, it’s important to also consider additional factors when developing synthetic controls.
Synthetic Control with Predictors
Similar to traditional matched market tests, synthetic controls benefit from analysis of more variables than just the KPI. This helps control for variables that would muddy the results of the analysis.
Market factors are a great place to start. Consider factoring at least one variable from each category below.
- Demographics/footprint: population, income, store count/size, drive-time catchment.
- Ops/pricing: price index, inventory availability flag, promo cadence.
- Category demand proxies: pre-period Google Trends, baseline foot traffic, search volume
- Baseline media intensity: pre-period search/social spend share.
Analyze these variables during the pre-test period only. The idea being that these inform test area selection instead of simply looking at them in post-hoc analysis.
Augmented Synthetic Control (ASC)
An augmented synthetic control starts using more advanced statistical models to identify four things:
- What is the pre-test expected value of sales?
- How do the actual results compare to my expected? – this is called the ‘residual’
- What the expected outcome (actual + residual) – this is called the ‘counterfactual’
- What lift did I see after my test – this is the actual results minus the counterfactual
Step 1: Build the Baseline (Expected Sales)
Using historical data and additional predictors (see above), build a regression model that is able to produce expected sales if nothing special happened.
This requires data inputs like 26-52 weeks of historical sales data in your test market as well as in the donor groups (contributing to the control). In addition, tracking static values like population, store locations, search volume, etc. help strengthen the model.
Step 2: Compute Residuals & Build the Synthetic Twin
Once the expected result is created, the residual is calculated using the actual sales.
Residual = Actual – Expected
This is calculated for the pre-test period as a way to understand any variations the predictors couldn’t identify. Once this process is completed for each market, a control group is created.
Step 3: Assemble the Counterfactual
Similar to the simple process, a control group is created from weighted donor audiences summing to 100%. Next, a counterfactual is created.
Unlike the previous process though, this counterfactual is the sum of expected results in the test market and residual from the donor (control) groups.
This effectively says ‘what would have happened without ads’.
Step 4: Measure Lift & Validate
Lift is ultimately measured using a standard formula: Actual – Counterfactual = Lift. % Lift can be derived simply be dividing that amount by the counterfactual.
Conduct some sanity checks to ensure the model is accurate. For example, matching pre-test performance between the treated audience and donor audiences, or removing one donor audience – this should not widely change the outcome.
ASC makes the most sense to use when there are a lot of factors to consider (i.e. pricing, holidays, uneven demand) or when there is a thin donor pool. In the case of our national advertising example, this would be a good option for analysis.
If team bandwidth is limited, companies like Analytics Edge or Haus offer platforms for Augmented Synthetic control models.
Design & Data Considerations
Regardless of the analysis method you choose, there are some constants that need to be kept in mind for clean analysis starting with test design
Test Design (Keep It Clean)
Maintaining a clean test window and short period post-test for analysis are crucial. This limits the potential for outcomes that are not explicitly a result of the test.
Note: A short post-test period of analysis helps account for things like conversion time lag.
Spill-over is a major consideration. When choosing markets for the donor audience, it’s important to limit overlap that would otherwise skew results.
The donor audiences must be untreated, so keeping at least a 20 mile radius between any donor audience and the test group is recommended to limit potential overlap.
Choosing Predictors (What to Include/Exclude)
In the world of advertising, there are some variables that stay consistent, and some that will always be changing. For the purpose of predictors (additional metrics to analyze), focus on unchanging ones.
Business performance (particularly sales) will be most impacted by the following:
- Store Locations
- Search Volume (in-market demand)
- Income
- Population
- Price index
Favor these over less predictable factors like seasonality swings, weather, or otherwise uncontrollable events. 5 good predictors is better than 15 noisy ones.
Market Selection (Right Level of Granularity)
Understanding these predictors on a market-level is crucial as well. For this reason, don’t choose markets that are too small – where audiences are so fragmented.
The smallest size area you should analyze in a test is a Metro Area (DMA), though it can be advantageous to look at larger areas like Regions/States.
Just make sure whatever region is chosen, there is reliable data on each of the predictors chosen.
Getting Started With Synthetic Controls
The world of statistical analysis opens up a whole host of possibilities, particularly in identifying how to improve marketing effectiveness. Synthetic controls let you measure incrementality when clean holdouts aren’t possible, they’re also practical to stand up with the data most teams already have.
To get started, gather:
- Choose regions (DMAs or states)
- Choose a KPI (sales, orders, etc.)
- Pick a window (26 or 52 weeks) and gather pre-test data
- Pick donor vs treated groups
WIth this data, you can create a baseline (start with just sales first, add a few predictors if easily accessible) and make residuals.
Create a synthetic twin with weights applied to each donor and use this to measure the lift of your treated area. Start with this simple model, then as you feel more comfortable, add in more predictors + regression analysis.
Why Synthetic Controls Beat Traditional Holdouts
Synthetic controls turn messy, real-world campaigns into credible experiments. By replacing a single “best guess” control with a data-weighted synthetic twin, you get a counterfactual that respects both how your test markets behaved before the test and what makes them comparable. The payoff is clear: cleaner lift reads, fewer debates about “but our markets are different,” and the ability to evaluate big, unavoidable initiatives (like national TV or retail pushes) without freezing spend.
Start simple—weekly KPI, a solid pre-period, and a handful of stable predictors—then graduate to Augmented Synthetic Control when you need extra rigor. If your pre-fit is strong and your placebos behave, you’ll have a measurement read you can take to the CFO with a straight face.