

How I Used Market Research to Build a Scalable Media Plan
Building a media plan from scratch is rarely straightforward. Every plan involves tradeoffs between awareness, engagement, and conversion, and those tradeoffs become more complex as budgets grow and timelines shrink.
That complexity is amplified when you’re planning a large budget over a short flight. Spending $4M in three months may sound simple on paper, but in practice it requires balancing channel mix, frequency, targeting precision, and scale
In this case, the challenge was even more constrained: the campaign was limited to the Seattle DMA.
Without national scale to absorb spend, every targeting decision mattered more. The plan needed to deliver both reach and efficiency, simultaneously.
This is the core tradeoff in strategic planning — you’re often designing for both scale and control at the same time.
These parameters came up in a plan I recently developed for a national home services marketplace supporting a new brand messaging initiative. This article walks through how I built that plan from the ground up, using market research to guide strategic decisions and ultimately create a prescriptive, scalable media plan.
TL;DR
To build a scalable media plan for a $4M, 3-month campaign limited to the Seattle DMA, I used public Census data to segment ZIP codes by homeowner density, homeowner volume, and renter concentration. By indexing and weighting these factors into a Media Efficiency Score, I created geographic tiers that balanced reach and efficiency. This framework allowed the plan to scale spend intelligently without sacrificing targeting precision.
Why Basic Geo-Targeting Isn’t Enough
A common approach in regional campaigns is to target the entire DMA and call it a day. While that ensures coverage, it ignores how dramatically neighborhoods can differ by demographics, housing type, tenure, and income.
At the other extreme, some advertisers try to over-correct by targeting very granular geographies – neighborhoods or ZIP codes with high audience affinity. While this improves efficiency, it often comes at the cost of scale and operational simplicity.
The problem with both approaches is that they treat geography as a binary choice:
- either broad and inefficient, or
- narrow and fragile
The goal isn’t to choose one or the other. The goal is to build a system that allows for precise targeting and efficient expansion.
Simply targeting the highest-affinity areas often lacks scale. Targeting the highest-density areas often lacks volume. A scalable plan needs both.
As with most good digital marketing strategies, the answer starts with data.
The Data Foundation: Defining the True Target Audience
Good marketing requires good market analysis. Even in broad, consumer-focused campaigns, the true target audience represents only a subset of the total population.
Finding that audience and more importantly, understanding where they live at scale, is a critical first step.
In this case, the target audience was homeowners. Fortunately, homeowner data is publicly available through U.S. Census datasets, making it possible to conduct meaningful analysis without proprietary tools.
Market Research Methodology: Building the ZIP-Level Dataset
To tailor the plan to a home services marketplace, I focused on identifying homeowners across the Seattle DMA. Using Census data, I pulled several ZIP-level datasets, including:
- Homeownership by ZIP code
- Age distribution by ZIP code
- Household income and poverty metrics by ZIP code
These lists on their own are large unstructured data dumps. To effectively analyze them first required a list of all zips from Seattle DMA.
This can be done a few ways. Public GitHub repositories often contain DMA-to-ZIP crosswalks, and while tools like Nielsen provide the same information, they aren’t free. Once the ZIP list was established, all population data could be filtered and aligned to the correct geography.
This is a good example of making confident marketing decisions with incomplete data. Using public datasets and a reasonable geographic crosswalk to build a plan that’s directionally correct and scalable.
With a clean dataset in place, the next step was deciding what to measure.
Separating Density, Volume, and Overlap
For this analysis, I wanted to understand three distinct things:
- What zips have the highest density of homeowners (as a percentage of households)
- What zips have the highest volume of homeowners (total count)
- Where those two groups overlap
This effectively creates three groupings.
- High Density Zips -> great efficiency, limited scale
- High Volume Zips -> reach drivers
- Overlap Zips -> combine efficiency and scale
To support this framework, three core metrics were calculated for each ZIP code:
- Homeowner density (% of households that are owner-occupied)
- Homeowner volume (total owner-occupied units)
- Renter share (% of renter-occupied households)
These metrics formed the backbone of the targeting strategy.
Building the Opportunity Index: Turning Data Into Priorities
This approach mirrors the logic behind a traditional Media Opportunity Index: identify areas where the target audience is both concentrated and present at scale, while minimizing waste.
In this case, renters were treated as a subtractive factor. Since renters are structurally outside the target audience for many home services, higher renter concentration represented inefficiency.
Indexing Measurement Metrics
To make ZIP codes comparable, each metric was indexed relative to the ZIP-level average across the DMA.
Example: Homeowner Density Index = [% homeowners (zip) / % homeowners (avg)] * 100
The same approach was applied to homeowner concentration and renter share, creating normalized indices that allowed ZIPs to be evaluated on the same scale.
It’s worth noting that while density and renter share benefit from indexing, volume was ultimately treated as a scale constraint, ensuring ZIPs were meaningful enough to support spend rather than simply ranking them by size.
Building the Media Efficiency Score
With indexed metrics in place, they were combined into a single score to prioritize ZIP codes.
Given the need to reach a large audience in a short time frame, volume was weighted most heavily, followed by density. Renter concentration was used as a penalty.
The resulting formula looked like this:
Media Efficiency Score = 45% * Homeowner Volume Index + 35% * Homeowner Density Index – 20% * Renter Waste Index
This score balanced reach, efficiency, and waste in a way that aligned with the campaign’s constraints.
Turning Research Into Strategy: Geographic Market Tiers
Using the Media Efficiency Score, ZIP codes were segmented into tiered geographic groupings:
- Primary Markets
- Core Markets
- Support Markets
- Test / Expansion Markets
- Deprioritized Areas
These tiers provided a clear framework for where to concentrate investment and how to scale outward.
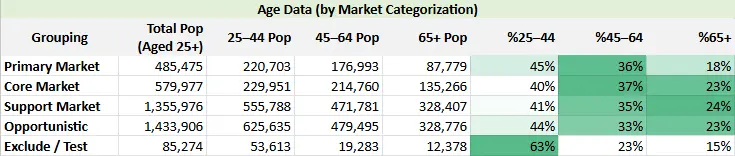
To validate the groupings, additional demographic layers were applied – particularly age and household income.
Age distribution was relatively consistent across tiers, which meant age was better used to inform creative and messaging rather than drive geographic exclusions.
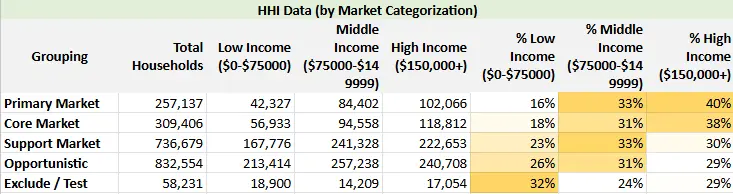
Household income, however, revealed a much clearer point of differentiation. Primary Markets skewed toward higher average HHI, aligning with audiences more likely to invest in home improvement and renovation.
With tiers validated, the next step was translating them into channel weights and budget allocation, similar to the thinking behind a lightweight media mix model.
Building the Media Plan: Channel Strategy by Market Tier
With geographic tiers established, the media plan could be activated with intention.
Primary and Core Markets received the highest share of upper-funnel investment, including:
- Connected TV
- Out-of-Home
- Audio
- Direct Mail
These channels helped build awareness and frequency where the highest concentration of homeowners lived.
Support and Expansion Markets represented a larger share of the total population but lower homeowner affinity. In these areas, the plan leaned more heavily on performance-driven channels:
- Google Search
- Meta
- TikTok
- Programmatic Display
Conversion-optimized buying allowed platforms to find the right users within broader geographies.
Retargeting and Search were deployed across all tiers, given their high intent and efficiency.
Scaling the Media Plan
Budgets were allocated using progressively broader reach targets across channels, ensuring frequency goals were maintained while allowing the plan to absorb increased spend.
Clearly setting marketing goals that tie back to business metrics is part of the process with new campaigns and existing campaigns alike.
This structure made the plan easy to scale – both by expanding geographic coverage within the DMA and, if needed, extending beyond Seattle entirely – without rebuilding the strategy from scratch.
Market Research Should Enable Scale, Not Limit It
The purpose of this exercise wasn’t to find the “perfect” ZIP code. It was to understand how audience concentration and audience scale coexist, and how media plans can expand without breaking.
Too often, market research is used to narrow targeting until delivery becomes fragile. This approach did the opposite. By separating density, volume, and overlap, the plan prioritized high-affinity areas early while remaining flexible enough to support millions of dollars in spend over a short flight.
Good market research doesn’t constrain media plans. It gives them room to scale intelligently.
When budgets are large, timelines are tight, and geography is limited, success comes from knowing where to start, how to expand, and why.