Ad Performance Forecasting: Why It Matters
In advertising, it’s not enough to guess what an outcome will be. Knowing what the most likely outcome of a marketing investment is crucial not only to the success of the business, but also to success of the plan.
Too many marketers are reactive versus proactive. Reactivity is getting a result and asking why this happened. Proactivity is getting a result and asking whether it confirmed or deviated from expectation.
One way we do that is through forecasting – the process of projecting results based on available data. We’ll start with a simple model, and work up to more advanced techniques, all with the same goal: predict with as much accuracy the outcome before we begin.
👉 Skip straight to the setup guide
TL;DR
Build your forecast:
- Use recent CPC/CPM (last 4–8 weeks) adjusted for seasonality
- Use same-month-last-year conversion rates adjusted for seasonality
Track your accuracy:
- Backtest monthly to measure bias and volatility
- Publish P10/P50/P90 ranges instead of single-point estimates
Keep it honest: Start simple, measure error, re-baseline after offer/UX/tracking/budget shifts.
Data Sources You’ll Use
At its core forecasting is the practice of predicting results from marketing activities. Most commonly used in advertising as a way to justify the investment, forecasting or projections are the foundation for success.
These models will often look at metrics like clicks and conversions because of their direct tie to sales and revenue.
There are two common types of data used in forecasting:
- Historical Data (recommended)
- Industry Benchmarks
Historical Data
The optimal method for forecasting because each company’s metrics are different, and historical data offers a perspective on how the company is improving over time.
Use at least 1 year of historical data to forecast to avoid measuring across different seasonality.
Having up to 2 years of past performance data helps create stronger projections by showing more trends in the market.
When historical data isn’t available (new companies or new campaign efforts), forecasting must fall back on industry benchmarks.
Industry Benchmarks
Industry benchmarks are a good fallback for businesses without much performance data. However, they are rarely as accurate and can set unrealistic expectations.
Many tools offer benchmarking, but the most realistic benchmarks all use a range vs absolute number.
The most popular metrics for industry benchmarking are cost per click and conversion rate since they offer a comparison between companies and platforms.
Example Industry Benchmarks (Google)
| Industry | CPC | Conversion Rate |
|---|---|---|
| B2B (average) | $5 | 1% |
| B2B (range) | $5 – $100 | 1% – 2.5% |
| e-Commerce | $2 | 2.5% |
| e-Commerce (range) | $2 – $10 | 2.5% – 5% |
| Non-Profit (average) | $5 | 2.5% |
| Non-Profit (range) | $3 – $10 | 1% – 5% |
Obviously this doesn’t look at the specific industry niches like Beauty, Home, B2B SaaS, B2B Finance, etc. That’s where a range is more applicable.
Finding accurate benchmarks is easy for platforms like Google, where average CPCs are shared in the keyword planner tool.
For platforms like Meta, benchmarks are a little harder to estimate. Meta’s benchmarks rely more on CPMs as they (along with CTR) dictate the cost per click.
Example Benchmarks (Meta)
| Industry | CPM | CTR | Conversion Rate |
|---|---|---|---|
| B2B (average) | $20 | 0.50% | 1% |
| B2B (range) | $10 – $50 | 0.25% – 1% | 0.5% – 2% |
| e-Commerce | $10 | 1% | 3% |
| e-Commerce (range) | $5 – $30 | 0.50% – 2% | 2.5% – 5% |
| Non-Profit (average) | $4 | 0.75% | 3% |
| Non-Profit (range) | $5 – $20 | 0.5% – 1.5% | 1% – 5% |
Bonus points for including some of the lesser known Meta Ads KPIs in your estimates.
In both examples, the average is not always accurate. Some companies with optimized websites and strong offers will drive better CTRs or Conversion Rates than those without.
Challenges with Benchmarks
Benchmarks face several key challenges which make them an imperfect solution to forecasting.
- Generalizability across various businesses
- Missing tactic-level consideration
Generalizability across businesses
While this is inherently necessary when forecasting, expecting a 2.5% conversion rate because it’s the industry ‘benchmark’ is not a good comparison when your landing page converts 1% of the time.
Sure this means there’s opportunity for improvement, but fails to set the right expectation.
Missing Tactic-Level Detail
Different advertising tactics have different benchmarks. For example, a Non-Brand Search ad might have a 5-6% CTR benchmark whereas a Brand Search ad might have a 20% CTR benchmark.
The same can be said for Meta where the benchmark CPM for Awareness tactics is $5 while Conversion tactics will run upwards of $20 CPMs.
These challenges create a messy system of forecasting wherein granularity becomes necessary.
Build the Base Metrics
Let’s start with a simple forecasting model to answer a simple question: If you put $100 into ads today, how many clicks and conversions can you expect to receive.
Data Requirements
Before beginning, make sure you have at least one year of platform-level (Google or Meta) historical data. Better yet, use a multi-touch attribution tool to track the metrics that matter across channels in one platform.
This data should include:
- Campaign Name (Tactic)
- Spend
- Impressions
- Clicks
- Conversions
Using this, create calculated metrics for each tactic that’s currently live.
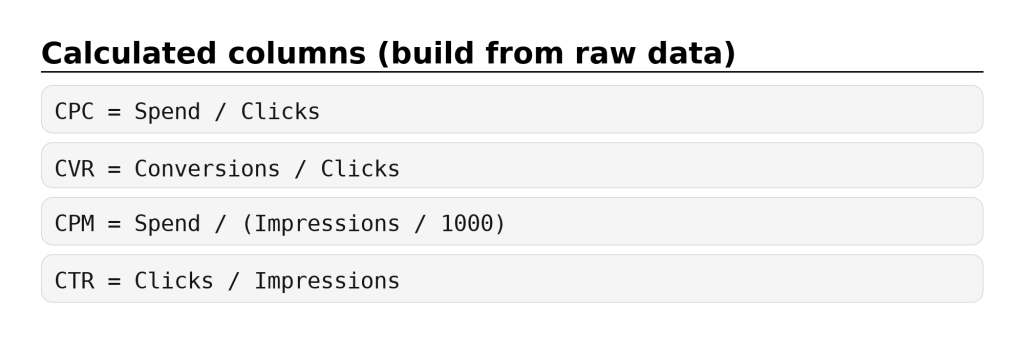
Your table will look something like this:
| Tactic | Spend | Impressions | CPM | CTR | Clicks | CPC | Conversions | CVR | |
|---|---|---|---|---|---|---|---|---|---|
| Non-Brand Search | $100 | 1000 | $100 | 5% | 20 | $5 | 1 | 2.5% | |
| Brand Search | $100 | 250 | $250 | 20% | 50 | $2 | 2.5 | 5% | |
| Meta | Awareness | $25 | 5,000 | $5 | 0.10% | 5 | $5 | 0 | 0.01% |
| Engagement | $50 | 5,000 | $10 | 1.5% | 75 | $0.67 | 0 | 0.1% | |
| Conversion | $100 | 5,000 | $20 | 1% | 50 | $2 | 1 | 2% |
The Key: Have these for at least the last 12 months (24 months if possible). This will enable a seasonality factor.
Baseline Forecasting Model
To limit comparison across seasons (which have different performance) a forecast model must look at year over year data.
Step 1: Seasonality Factors
Pull monthly conversion rate and cost per click for the last 12 months (or 24). Use these to calculate a Seasonality Factor.
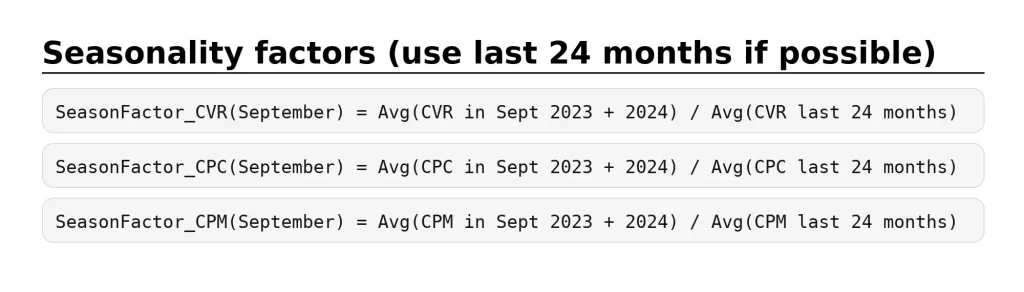
For example, let’s say September is higher seasonality for my product. The SeasonFactor will account for this with a multiplier that will be factored into the predicted metrics.
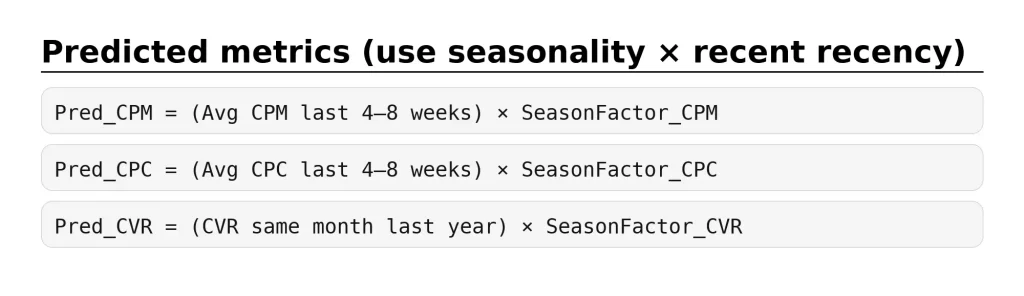
Step 2: Predict CPC/CPM/CVR
To create predicted metrics for CPM, CPC, and CVR, pull historical data that best informs these metrics.
Since CPM and CPC typically trend up over a year (due to increased advertiser competition), pull these from the last 4-8 weeks.
Conversion rate is often much more impacted by seasonal factors, so use data from the same month of last year.
Once these metrics are calculated, metric volume can be calculated using expected spend.
Step 3: Convert Spend to Volume
Add expected spend for the month for each tactic and complete the following calculations:
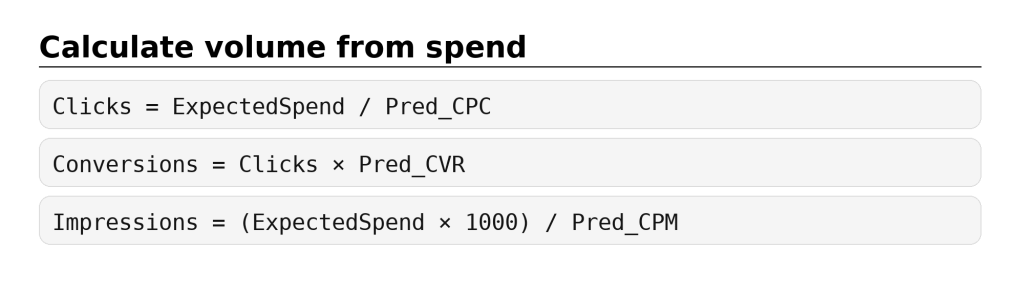
Use these formulas to calculate things like expected CTR and expected CPA.
Note: forecast per tactic, then sum totals.
Step 4 (Optional): Forecast Ranges
As you begin tracking projections and actuals, building uncertainty ranges into future forecasts can help improve accuracy. Start by tracking how far off the actual is from your prediction.
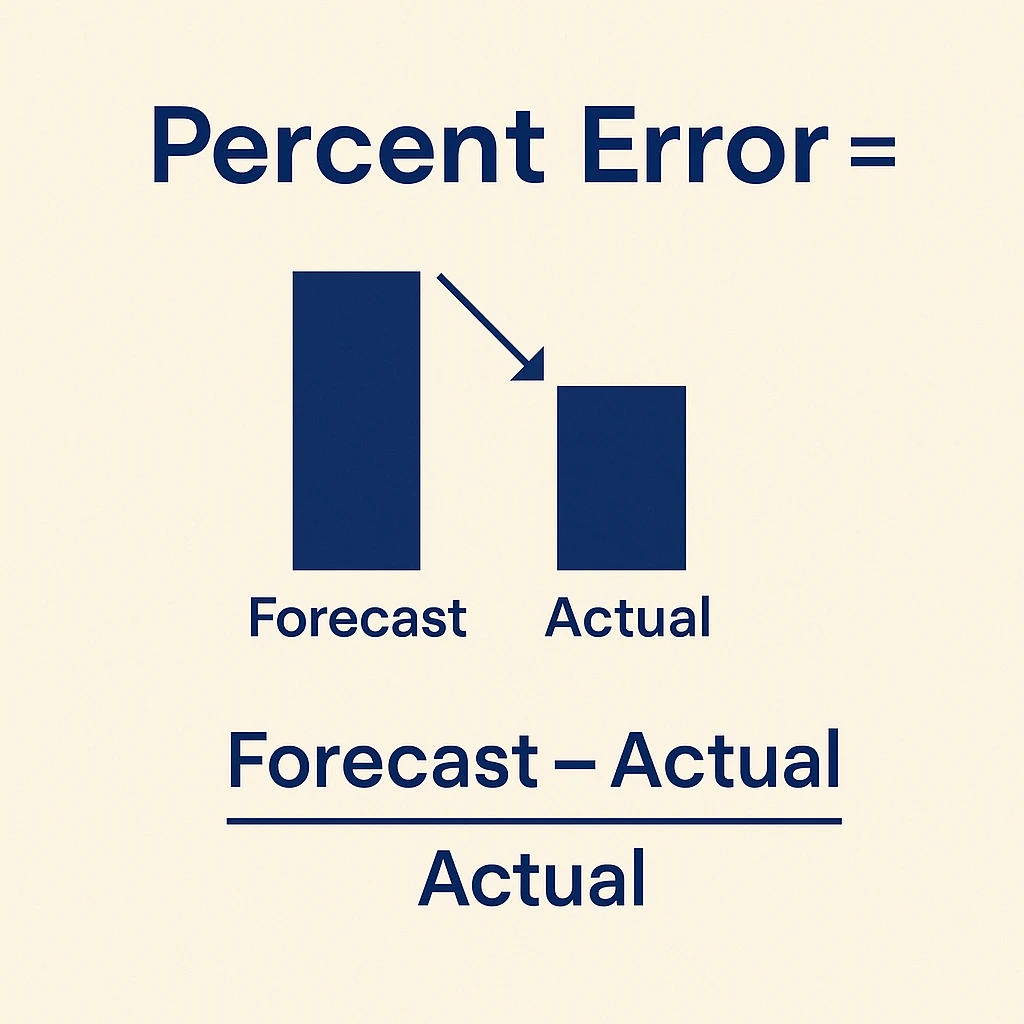
Percent error provides a way to measure the quality of your past projections. Finding the margin of error makes future forecasts more accurate.
Percent Error = (Forecast – Actual) / Actual
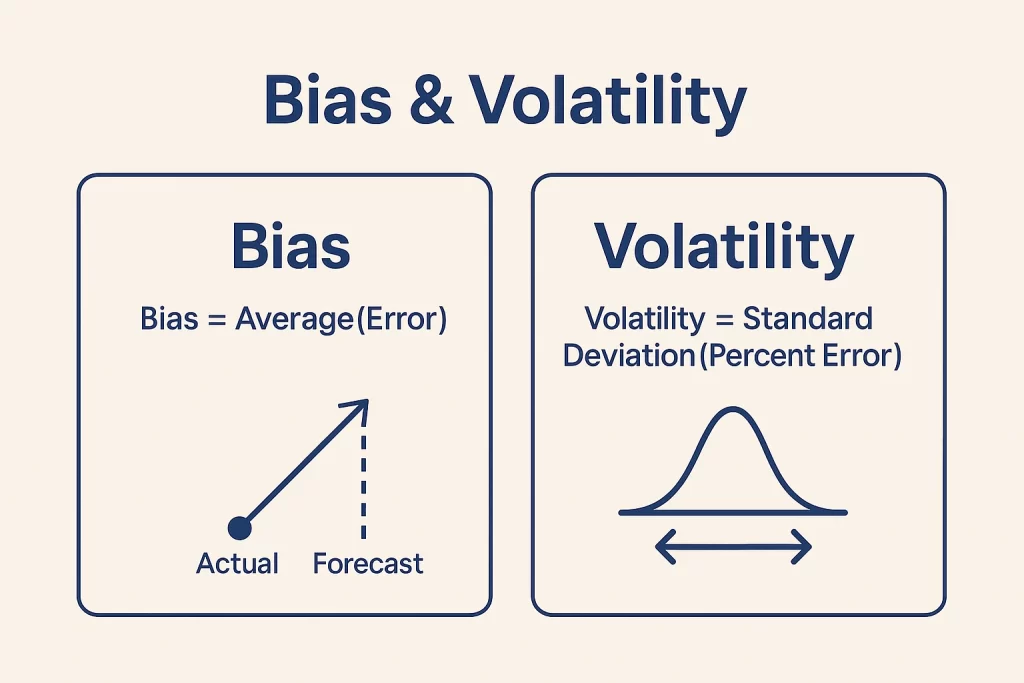
Do this for each metric each month and keep track of these to create Bias and Volatility calculations.
Bias and Volatility improve forecasts by measuring a range instead of an absolute value.
Bias = Average(Percent Error)
Volatility = Standard Deviation(Percent Error)
Since these are aggregate metrics, they will only get more accurate over time.
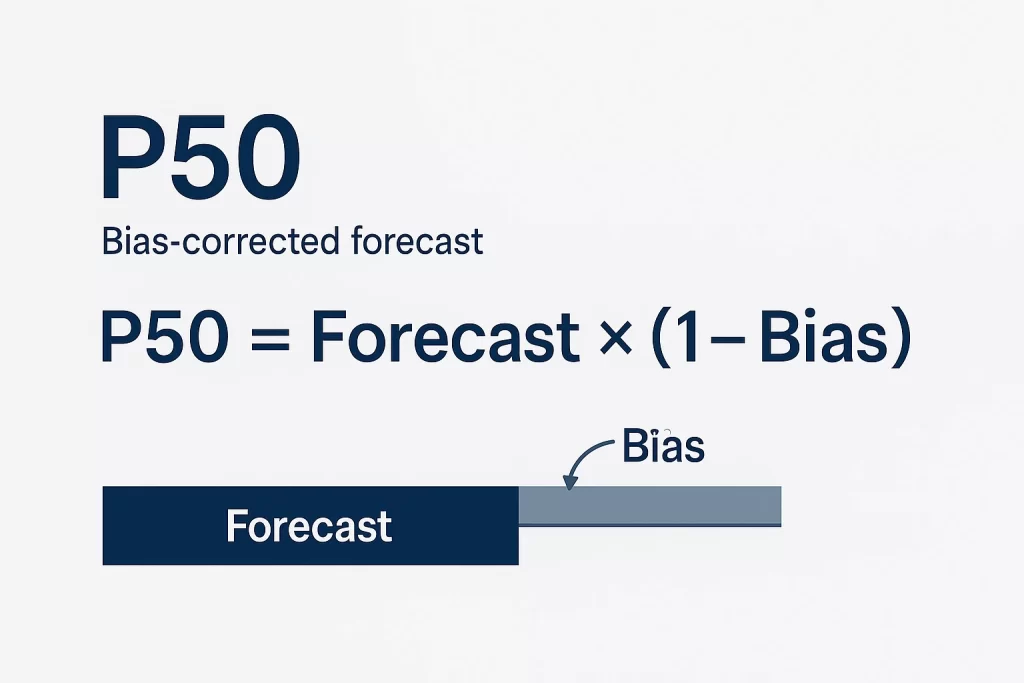
Use your average bias calculation to find an bias-corrected forecast.
P50 = Forecast_this_month × (1 − Bias)
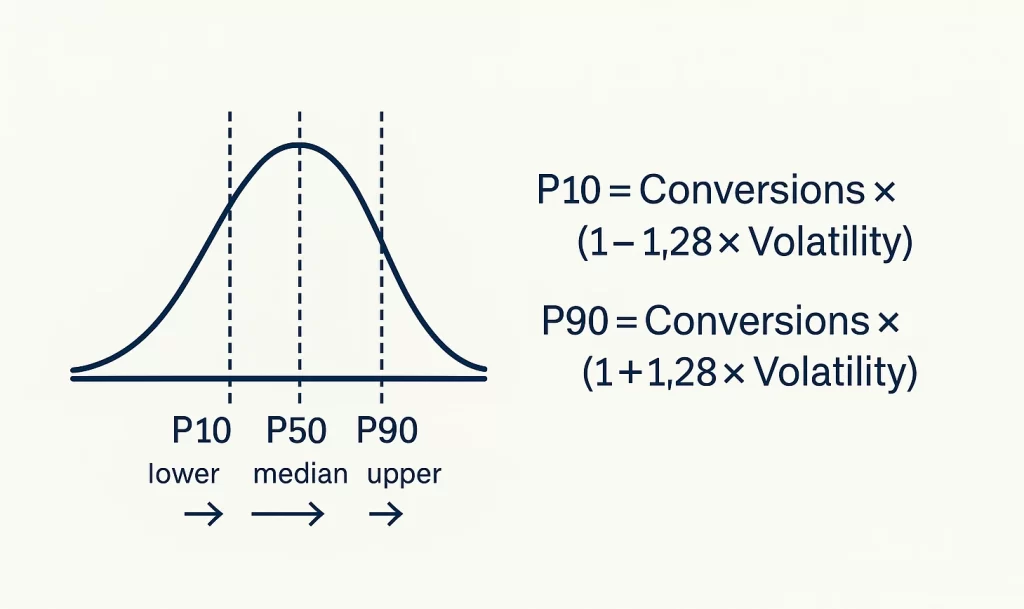
From here, you can create a standard deviation. P10 represents the extreme low end of the forecast while P90 represents the extreme high end.
P10_Conversions = Conversions × (1 − 1.28 × Volatility)
P90_Conversions = Conversions × (1 + 1.28 × Volatility)
Remember: These calculations can be done for each metric, though Conversions is the most important.
Ultimately, they provide better understanding for what is ‘good’ and what is ‘bad’ to inform future optimizations and strategy.
Limitations & How to Hedge
While this method works well on a basic level, it faces several challenges.
Assumes nothing changed Y/Y
Using the same-month last year conversion rate does not take into account any UX or offer changes in the last year. If the website significantly improved, the conversion rate may need to be adjusted.
Fix: Weight last years CVR 70% and the last 4 weeks’ converison rate 30%
Can miss conversion delay
Conversion delay or time lag is the process of delayed attribution. Conversions may not be attributed to clicks for up to weeks or months, making conversion forecasts less accurate.
Fix: Pull total conversion volume up to 1 week or more following the end of the month.
Doesn’t address mix shifts
If you change the strategy by reducing brand campaign spend and focusing more on non-brand, performance will look significantly worse Y/Y.
Fix: Forecast by tactic to get a better pulse on how each tactic performs compared to itself.
Requires extensive historical data
WIthout at least 12 months of data, forecasting with this method becomes unreliable. For more accurate prediction, rely on benchmarks to fill the gaps.
Fix: Start with your goals, and back into acceptable projections from there.
Ultimately, more advanced models can help create even more accurate forecasts, but this method is a great starting point.
Getting Started With Ad Forecasting
Forecasts shouldn’t be guesses—they’re guardrails for decision-making. By forecasting per tactic, pricing media with recent CPC/CPM, anchoring intent with same-month-last-year CVR, and applying seasonality factors, you get a baseline that’s simple and reliable. Add P10/P50/P90 ranges from backtests and the conversation shifts from “what happened?” to “did results meet expectations—and why?”
Keep it honest by re-baselining after major changes (offer, UX, tracking), and refresh mid-month with a quick nowcast. If optimization methods changed, add weights to your forecast to consider this.
Remember: accurate forecasting starts with accurate data. Start simple, measure the error, and iterate—your accuracy (and plans) will only get better.