Stop Tracking Vanity Metrics: Focus on These Meta Ad Performance Metrics Instead
Meta Ads gives you dozens of metrics to track, but most advertisers focus on the wrong ones. Without the right measurement framework, you’ll waste budget on campaigns that look successful but don’t drive real business results.
This guide covers the metrics that actually matter: acquisition, engagement, and conversion. We’ll show you how to measure custom metrics like See More Rate and Thumbstop Rate, plus tie your campaigns back to business goals and profitability.
Stop chasing vanity metrics. Start measuring what drives revenue.
📋 TL;DR
- Stop chasing vanity metrics – Most advertisers focus on the wrong performance indicators. Impressions and website visits don’t correlate with business results.
- Use custom metrics – See More Rate, Thumbstop Rate, and New Customer Acquisition Cost provide deeper insights than standard Facebook metrics
- Optimize holistically – Ad performance has different KPIs than site performance and business performance. Use each to diagnose where improvement is needed.
Advertising Measurement Framework: Defining Campaign Success
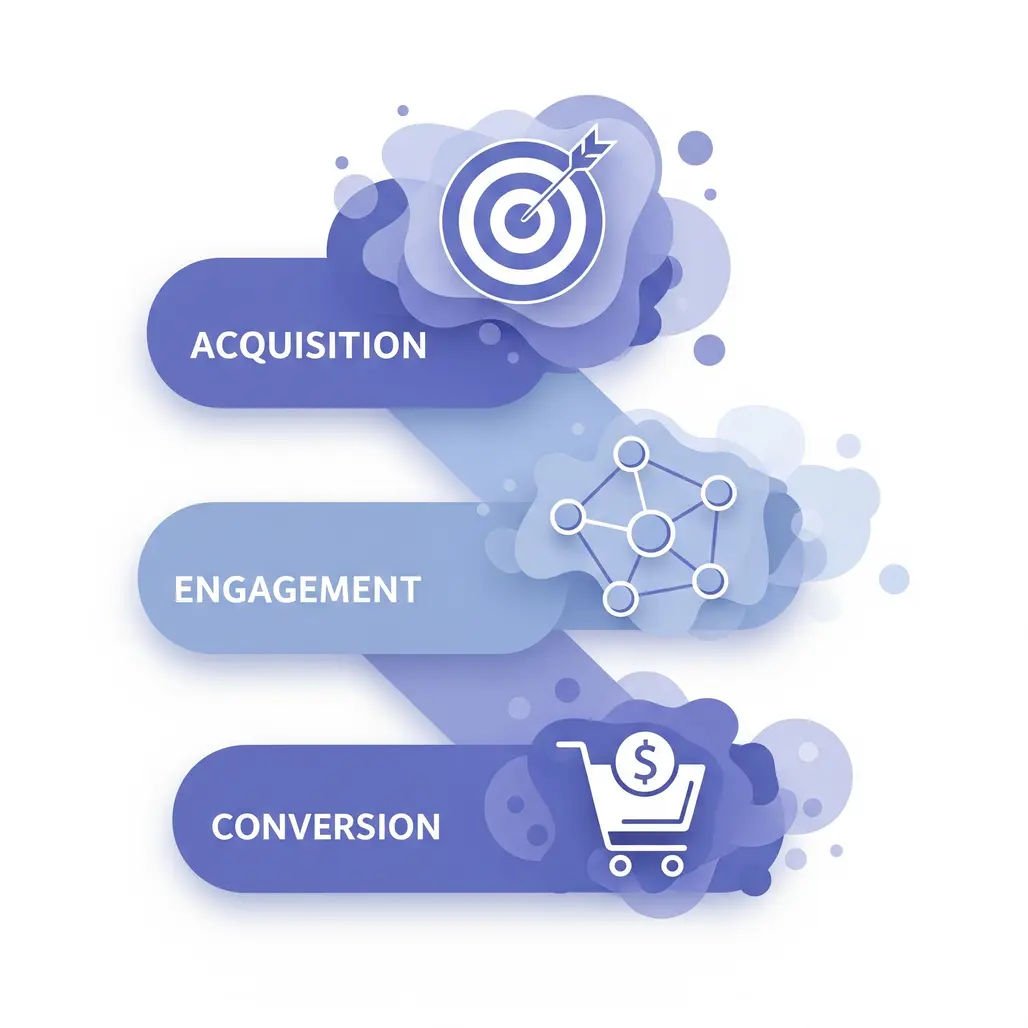
Ad performance metrics can be broken down into three categories based on goals:
- Acquisition: How effective campaigns are capturing traffic
- Engagement: The quality of traffic captured by campaigns.
- Conversion: The effectiveness of targeting + user experience
Each objective contains several key performance indicators (KPIs) that serve as guides when optimizing campaigns.
For more on optimizing Facebook campaigns, see How to Optimize Meta Ads.
Acquisition Metrics: How to Measure Traffic Quality and Cost Efficiency
Acquisition has the goal of capturing attention and interest in a product or service. Serving as the first step in a user’s journey, key ad performance metric focus on how to most capture attention most efficiently.
These metrics are based on traffic (clicks) and look at the performance of ads through efficiency (the best results for least cost).
Key Metrics:
Click-Through Rate (CTR): Measuring Creative Effectiveness
Click Through Rate measures the ratio of clicks vs impressions and identifies how effective a creative and ad copy are at enticing a user to click. This metric is used to determine which ad is driving the most engagement so elements of that ad can be used more widely and further tested.
A low click through rate (less than 1%) means that either the ad is not reaching the target audience, or the message is not compelling. Optimizations can include revising the ad headline, changing elements of the image or video, or simply changing targeting settings.
Cost per Click (CPC): Your Profitability Foundation
Cost per click measures the average cost to drive a click. It’s a measure of both cost per impression and click through rate to determine how efficient campaigns are at generating interest in the brand.
This metric is particularly important because of its ability to project results. With a cost per click and conversion rate, we can determine the cost per conversion and ultimately determine how to scale up an ad campaign based on where to drive improvements.
For this reason, cost per click one of the most important key performance indicators due to it’s place in the cost calculation for profitability. A higher cost per click means less chances to convert a customer and generate revenue.
Learn how to measure ad campaign performance against business goals in Setting Marketing Goals.
See More Rate: The Hidden Ad Copy Engagement Metric
See More Rate is a metric that helps determine ad copy engagement. Clicking ‘see more’ indicates the ad copy was enticing enough to get a reader to want to expand it.
It’s unique to Meta Ads as its a custom metric built from several native metrics. To build this metric yourself, simply create a custom metric in the Meta Ads manager like so:
See More Rate = Clicks (All) – Link Clicks – Post Shares – Post Likes – Post Comments
The only catch with See More Rate is it requires a primary text of greater than 125 characters so that some of the text is hidden behind a ‘see more’ button. However, optimal copy often exceeds this length making this metric easily accessible.
Low See More Rates (below 0.25%) mean that the copy is not compelling enough to read more. Adding more compelling copy like statistics, customer quotes, or questions above the fold can help entice readers to ‘see more’.
Thumbstop Rate: Measuring Video Hook Effectiveness
Given Meta Ads charge per impression, it’s important to make each impression count. If users are scrolling past your ad without consuming the content, there is minimal impact.
Thumbstop rate is another custom metric that measures the effectiveness of video ads to capture user attention. It’s calculated as follows:
Thumbstop Rate = Video Plays / Impressions
This metrics gives a directional insight into how engaged an audience is and whether they’re taking the time to start a video.
While it’s not perfect, it can be coupled with Hook Rate to find out how many users dwelled long enough to at least watch the hook of the video
Including content hooks that empathize with watchers through identifying common problems or solutions to problems they’ve tried are effective ways at capturing attention.
All four Facebook ad metrics discussed above are key in analyzing the performance of advertising at the individual ad copy and creative level. Engagement metrics take this one step further by looking at how the ad and website experience work together.
Engagement Metrics: Measuring Traffic Quality Beyond Clicks
Engagement metrics are essential to understand the quality of user experience. They provide insight into:
- Whether the right audience is being reached
- How the website experience is perceived by users
- What the audience values most
Key metrics can help identify the answer to each of these questions and help drive improvement in strategy for each of these areas. Let’s start with whether the right audience is being reached.
Engagement Time: Are You Reaching the Right Audience?
A potential customer needs to spend some time on your site consuming content as they consider a purchase. Engagement time provides a measure of this: the quality of a user session based on how long they are engaged
Measure this metric through any onsite analytics platform like Google Analytics and use it to measure channels, campaigns, and even creatives against each other. The goal is driving the most cost-effective engaged traffic.
Social media traffic will generally be less engaged as it’s interruptive media – aiming for onsite sessions of 30s or more is a good general benchmark. Search traffic will typically be much higher (over 1min on average) as it’s inbound and based on keyword intent.
All ad platforms take engagement time into consideration when optimizing ad creatives (as long as a pixel is placed on your website), so this won’t be used for optimization but rather understanding why certain ads are being prioritized.
Understanding engagement and how users perceive your website experience is crucial to driving results. Metrics that not only look at duration of engagement but depth of engagement provide this insight.
Engagement Depth: Measuring True User Interest
Engagement depth can be measured in several ways. The most common way is to look at a metric like views per user (how many pages did a user browse in their time on your site). This will tell determine if there is enough information on page to entice a user to explore further.
Low views per user (less than 1.1) indicates a need to revise calls to action or information presented upfront to get readers interested in what they’re seeing. It can also mean that the ad + landing page experience is misaligned. Connecting the experience between both (known as ad scent) is important in meeting user expectations.
Another key metric for engagement depth is scrolling. Scroll depth can be set up in Google Analytics to measure when a user has scrolled 25% of the page, 50%, 75% and so on, and gives a good measure of how much content users are reading. Keep in mind, some users will simply scroll all the way without reading. User browsing behavior is never that simple.
AnalyticsMania has a straightforward guide for setting up scroll tracking in GA4.
Regardless, these metrics will help identify the quality of engagement and particularly how to make on-page optimizations. Understanding what sections or actions on site are driving quality engagements is the final piece of the puzzle.
Micro-Conversion Rate: Actions That Drive Engagement
Unlike engagement time and depth which are factors in creative optimization on Meta Ads, micro-conversions need to be set up as unique events. Micro-conversions are defined as actions (button clicks, multiple page views, tool engagements, etc.) that signal deeper engagement.
The robust conversion tracking system in Facebook ads manager allows for such events to be created. While these are important to the campaign objective, they are usually not used as optimization signals. Rather, they can help in analyzing performance of awareness and consideration tactics.
Think key actions short of purchase or lead that contribute to consideration – find directions, submit request, customize product, etc. Standard facebook ads metrics exist for these, or you can create custom metrics in the dashboard for any custom conversions.
Tracking these micro-conversions as a rate helps compare across campaign where the desired outcome may varies. Each specific metric can be tailored to specific advertising efforts to gain a better understanding of where each advertising campaign lives in the marketing funnel.
This just leaves conversion metrics, the most important metric type, due to their proximity to attributable revenue.
Conversion Metrics: Measuring What Actually Drives Revenue
Conversion metrics provide insight into how well the message was communicated, the offer received, and whether the entire funnel – from ad to landing page to checkout – is working effectively. These metrics directly tie advertising efforts to business results.
As such, measuring conversion metrics is crucial to a successful Facebook ad campaign. See best practices for setting up Meta’s conversion tracking system.
Key Metrics:
For a more robust conversion measurement system, implement Meta’s Conversions API and import Offline Conversion Tracking to track confirmed customers.
Conversion Rate: Measuring Offer Effectiveness
Defined as conversions divided by clicks, this metric measures the rate at which users complete a desired action, often key actions like purchases or lead form submissions.
Where engagement metrics determine the quality of content and user experience, conversion rate looks at the quality of your marketing offer. A marketing offer is the way to entice users to provide their information or purchase a product – think free guides, product discounts, bundled deals, etc.
Assuming the product education was communicated well, the offer should drive conversions. A low conversion rate (<1%) means that somewhere along this path from education to offer, the user did not receive the information they needed.
To fix this, testing different calls to action, or simply changing the strategy to provide more education before asking for a sale can be effective. For example, with a larger purchase ($1,000 or more), leading with a free guide or case study – showing real world use cases and information – helps build consideration in a low-stakes manner.
This also gives you the chance to provide follow-up information through email or through targeted remarketing so that any questions or hesitations are answered before a purchase is considered.
Cost per Conversion: The Profitability Benchmark
Cost per conversion is measured as the average spend per conversion. Because it’s tied to dollars (efficiency), it becomes one of the most important metrics to evaluate campaign success.
Facebook advertising as a whole operates sustainably on net profitability, which can only be achieved through a cost per conversion lower than the sum of revenue minus cost of operations and goods. To this end, campaign goals need to include a cost per conversion target. See more in Setting Marketing Goals.
If campaigns are failing to hit their target, work must be done to improve either:
- Cost per click through more effective targeting or creative
- Conversion rate through landing page or offer optimization
Assuming the cost per conversion is within an acceptable range, revenue is the next consideration.
Return on Ad Spend (ROAS): Balancing Prospecting vs. Retargeting
ROAS measures ad efficiency against revenue. This helps determine if marketing efforts are truly profitable. However, it’s important to verify this against your own analytics to ensure accuracy.
Both models generate an efficiency ratio. A ROAS of 3:1 means you generate $3 in revenue for every $1 spent.
ROAS requirements vary by industry and business model. For example, an ecommerce business might generate a lot of returning customer revenue. While great for sustaining the business, it won’t effectively scale up sales.
Different tactics will also have varied ROAS measurement. For example, prospecting campaigns will often report low ROAS (<1.0) due to their proximity from the last click sale. A good rule of thumb is the following:
- Prospecting ROAS: 1.0 or higher
- Retargeting ROAS: 5.0 or higher
This way, you can balance spend between the two campaigns types to generate an acceptable ROAS for profitability. Typically, it’s recommended to achieve a ROAS of 4.0 or higher in aggregate. However, each business should determine what is acceptable based on their margins.
Ziggy Agency has a a more complete list of ROAS benchmarks by industry.
To better understand scalability of Facebook ad campaigns, it’s necessary to consider the difference between new and returning customers.
New Customer Acquisition Cost (nCAC): The Growth Metric That Matters Most
While cost per conversion tells you the efficiency of driving any conversion, new Customer Acquisition Cost (nCAC) focuses specifically on first-time customers – arguably the most important metric for sustainable growth. Because each customer has a lifetime value (LTV) – the amount of revenue they generate over the course of being a customer – it’s possible to calculate an acceptable cost based on future sales.
Measuring nCAC requires tracking outside of the Facebook ads manager, often in a CRM or 3rd party reporting tool. To set it up requires special attention to:
- Tagging new vs returning customers in your CRM
- Importing new customer conversions to Meta Ads
- Creating custom audiences in Meta for existing customers
These steps will further enhance ad reporting and optimization as focus shifts to driving first-time customers needed to scale campaigns effectively.
Similar to ROAS, there is a healthy ratio of nCAC to LTV that typically falls into a ratio of 3:1 or higher. However, this is unique for each business depending on the frequency of purchases or potential for upsells or cross-sells.
Measuring conversions is only effective way to prove out the return on investment (ROI) of marketing efforts, which ultimately makes marketing worth the investment.
Measuring Meta Ads Performance: Putting It All Together
Effective Meta Ads measurement requires tracking metrics across all three categories – acquisition, engagement, and conversion. Each serves a unique purpose in understanding and optimizing campaign performance.
Use acquisition metrics to:
- Identify which creatives and copy drive the most interest
- Optimize cost efficiency at the top of the funnel
- Test new audiences and messaging approaches
Use engagement metrics to:
- Ensure you’re reaching the right audience
- Optimize the post-click experience
- Identify content that resonates with your target market
Use conversion metrics to:
- Measure business impact and ROI
- Optimize for profitability over vanity metrics
- Make strategic budget allocation decisions
The key is not to optimize for any single metric in isolation, but to understand how they work together to drive business results. A campaign with great click-through rates but poor conversion rates needs different optimization than one with low engagement but high conversion rates.
Start with your business goals and a resilient tracking setup, then work backward to identify which metrics matter most for your specific objectives. No matter your campaign objective, having the right measurement framework in place is essential for Meta Ads success.