Creative Analysis in the Meta Andromeda Era: Best Practices for 2026
For years, creative analysis was simple: Pick your KPI, check which ads hit the lowest CPA, pause the losers, scale the winners.
That model died with Andromeda.
Meta’s new AI stack doesn’t optimize around isolated ads anymore. It evaluates creative portfolios: 25+ assets working together to move a user from curiosity → intent → conversion. That means your “best-performing” ad might actually depend on the ads with the worst CPA.
In other words: looking at creative on a per-asset basis doesn’t work anymore.
You need a new framework that evaluates how creative contributes to the entire user journey, not just the final click.
This article breaks down how creative analysis works in the Andromeda era, why traditional metrics mislead you, and the how to adapt your advertising system heading into 2026.
TL;DR
- CPL lies in the Andromeda era. It only shows which ads closed, not which ads created demand.
- Andromeda mixes all audiences, so creatives must be analyzed as a portfolio.
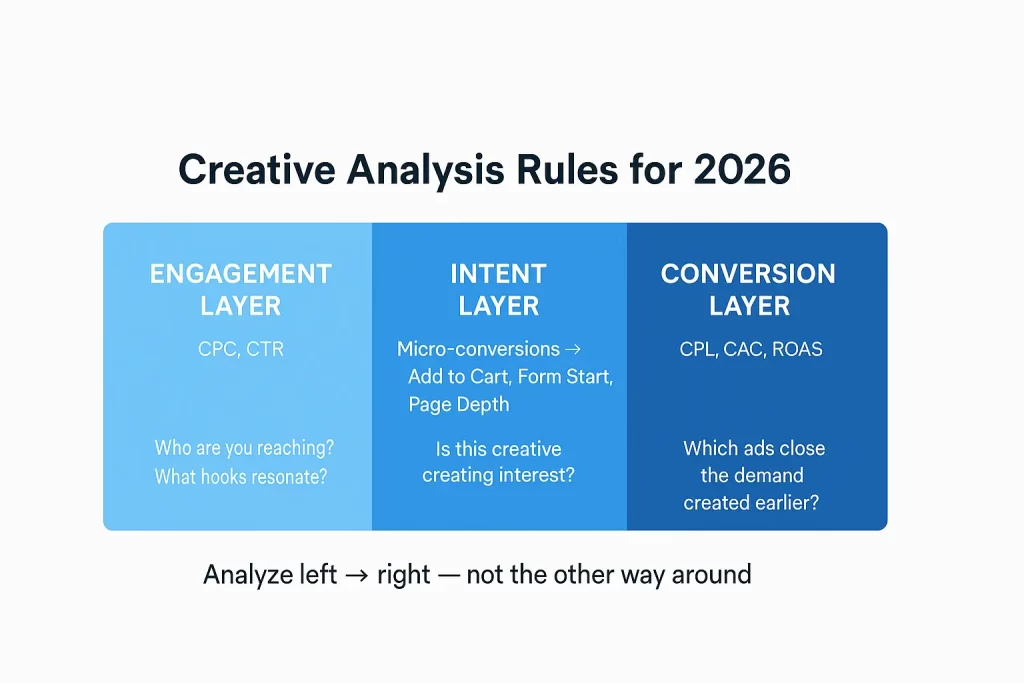
- Use three layers of analysis: CPC → micro-conversions → CPL.
- Look at creative topics, not single ads.
- Refresh creative often and only pause ads that fail across every intent layer.
Why Cost per Conversion Doesn’t Tell the Full Story
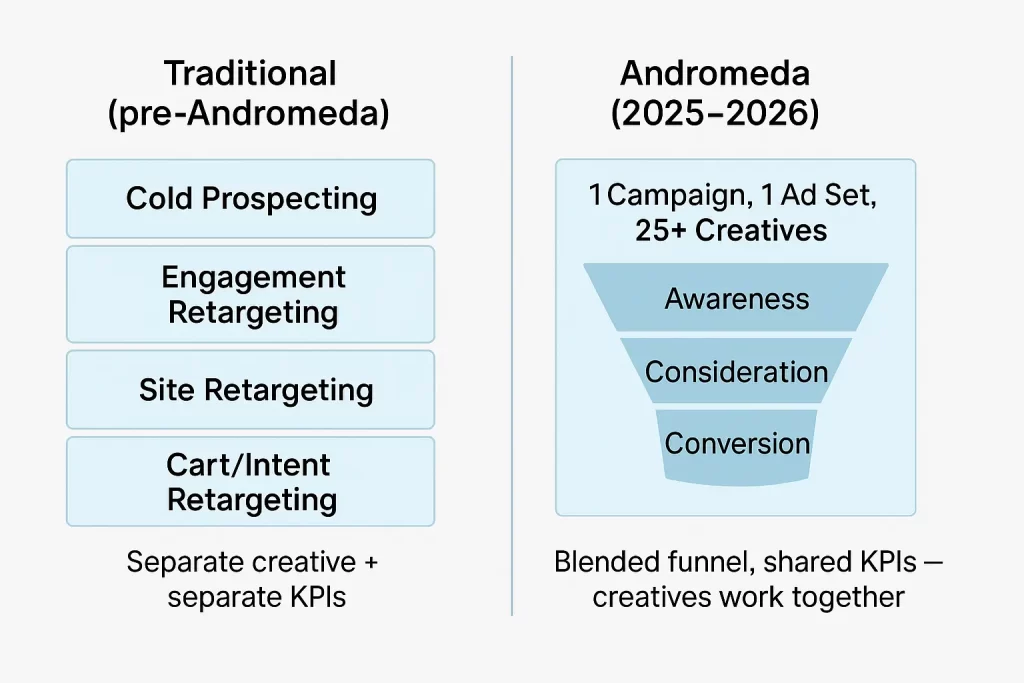
In the old structure, CPL worked because you controlled which audience saw which message.
Each ad set mapped to a different stage of the user journey, and therefore every creative inside that ad set played roughly the same role. You had Cold Prospecting ads for education, Retargeting ads for intent, and Cart ads for conversion — clean, segmented buckets with clean, segmented metrics.
And then Andromeda removed that control.
With a single blended ad set serving the entire funnel, Meta is no longer dividing users by journey stage. Instead, the algorithm mixes all traffic together and chooses the creative that best fits where a user currently is in their journey.
That means:
- A testimonial ad might be shown to a cold user
- A product demo might be shown to a returning user
- A “buy now” ad might land on someone who’s never heard of you
All in the same ad set. All at the same time.
This is why CPL consistently undervalues top- and mid-funnel creative.Those ads aren’t meant to convert, but rather create demand, shape intent, and feed the ads that do convert.
When every ad serves the entire audience, Meta naturally attributes conversions to the bottom-funnel assets, even if those ads only succeeded because something earlier in the sequence did the heavy lifting.
In the Andromeda era, CPL only shows you which ads closed.
How to Conduct Effective Creative Analysis
An analyst worth their salt understands that creative analysis is not an exact science, but rather an endeavor to understand what’s working and why.
To that end, there are several rules that must be followed to ensure any modicum of scientific rigor.
Using Statistically Significant Results
Data analysis of any kind relies on a threshold of volume to reach significance. In the world of ad creatives, this equates to a threshold number of impressions or clicks or conversions.
Impressions show whether Meta tried to deliver the ad; clicks show whether users actually engaged.
Was that ad really engaging, or did it only reach a handful of users and not test against the whole audience?
A good rule of thumb is to exclude any creative from analysis that don’t have at least:
- 5000 impressions
- 100 clicks
For smaller advertising budgets, let ads run longer to ensure you’re hitting these thresholds.
Measuring More Than One Metric
In Andromeda, metrics are less about performance and more about diagnosing which stage of the journey the ad is influencing.
First, establish what the ad was aiming to do:
- Is this an educational ad?
- Does it drive to a page that just provides information?
- Is there a direct call-to-action to buy now?
Ask these questions to better understand what metrics to analyze.
When in doubt follow these guidelines:
- Educational/Informational – Cost per Click, Click-Through Rate
- Comparison/Product – Cost per Page View/Add to Cart
- Sale/Call to Action – Cost per Conversion
You’ll want to look at a combination of these metrics for each ad. Just remember to pay special attention to where in the user journey each ad likely lives.
Considering the User Journey
Each ad you create should have a specific purpose. It’s part of the reason Meta is calling for more creative diversification.
Upper funnel (educational/informational) ads that identify user problems, tell the story of a brand or product, or simply try to align with a specific persona will not drive the last click conversion.
Remember, the user journey is typically not fast or linear (i.e. flooring customer journeys can take up to 6 months)
This is why CPL can’t be the dominant metric. Most ads in a portfolio were never meant to drive the final action.
How to Interpret Spend in Andromeda
Meta Andromeda has flipped creative & messaging strategy on its head. Without clear audience delineation, picking just one KPI leads to fuzzy analysis that often misses part of the picture.
Once you accept that audience segmentation no longer exists, you need a new way to interpret creative intent.
Spend Becomes Your Friend
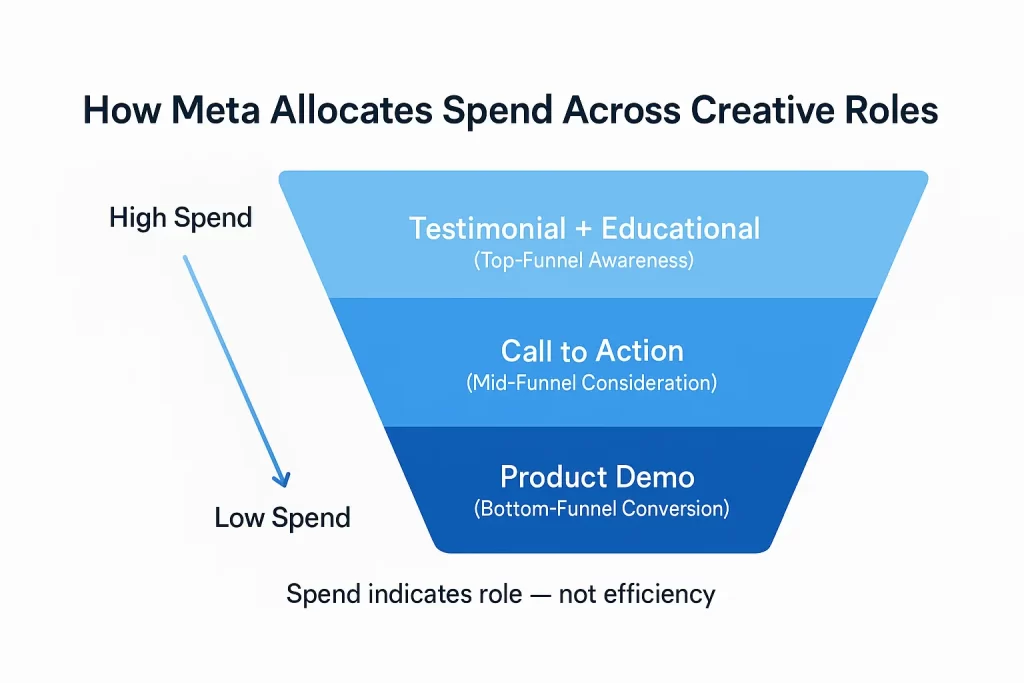
When Meta spends heavily on an ad, it’s not ‘favoritism’ – it’s the system telling you the ad is useful for a specific stage of the journey.
Take for example this campaign performance:
| Ad name | Cost per Lead | Amount spent (USD) |
| Testimonial | $495 | $69,331 |
| Educational | $591 | $66,835 |
| Call to Action | $412 | $49,552 |
| Product Demo | $429 | $24,499 |
| Average | $562 |
Traditional logic would dictate pausing the Testimonial and Educational ad based on their higher Cost per Lead. However, this overlooks their role in introducing the brand to new users.
If spend shows you what Meta values, CPC shows you how users interact with it.
Cost per Click Remains Relevant
Engaging your audience is the primary goal of an ad. Lower cost per click means the ad is doing this effectively.
Looking at the same data with cost per click shows it’s impact.
| Ad name | Cost per Lead | Amount spent (USD) | Cost per Click |
| Testimonial | $495 | $69,331 | $2.07 |
| Educational | $591 | $66,835 | $2.56 |
| Call to Action | $412 | $49,552 | $2.87 |
| Product Demo | $429 | $24,499 | $3.79 |
| Average | $562 | $2.24 |
The two ads with the most spend drove more efficient traffic – explains why Meta was prioritizing them.
Micro-conversions tie the first two layers together: system preference and user intent.
Use Micro-Conversions as Intent Indicators
Micro-conversions – the actions users take prior to the end of their journey – are valuable signals that you’re reaching the right audience.
Example Metrics:
- Add to Carts
- Begin Checkout
- Form Starts
These actions typically have less attribution lag because they have a lower barrier to entry, making them good analysis signals.
When this is overlaid on the same data from before, it’s easy to see why certain ads are prioritized.
| Ad name | Cost per Form Start | Cost per Lead | Amount spent (USD) |
| Testimonial | $69 | $495 | $69,331 |
| Educational | $67 | $591 | $66,835 |
| Call to Action | $52 | $412 | $49,552 |
| Product Demo | $78 | $429 | $24,499 |
| Average | $75 | $562 |
The data clearly shows where each ad lives in the user journey. Those with lower cost per click and form starts are in the beginning of the journey while lower cost per lead are the end of the journey.
Prioritizing micro-conversions in a feeder campaign is an effective way to make sure you’re reaching an upper and mid-funnel audience
When To Pause Ads
Typically, if an ad isn’t performing well, it won’t spend. However, there are occasions where manually pausing an ad is recommended.
Ads Are Underperforming
Only pause an ad if it fails across all three layers: CPC, micro-conversions, and CPL — and Meta gave it enough spend to judge it fairly.
Often times, these ads will be brand-focused with no call to action. While effective at building brand lift (assuming they meet media minimums), these ads do not belong in conversion campaigns.
Do not pause ads solely because they have high CPL. That ad may be the reason your bottom-funnel ads are converting cheaply.
Creating topic clusters (i.e. testimonials, product demos, buy now) is a good way to validate what works and what doesn’t.
Ad Performance Declines
While ad fatigue is based on audience size and spend in a given period of time, all ads (when served over a long period of time) will lose effectiveness.
There is no single rule of thumb, but ads that are in market for 6-12 months and receive consistent spend are at the highest risk of fatigue.
Small audience sizes (due to geotargets or retargeting) will also experience ad fatigue more quickly. Make sure to have a consistent flow of creative refreshes to keep messaging fresh.
If you want a deeper breakdown of why fatigue is often a delivery concentration problem, I break down a full creative portfolio framework here.
Creative Analysis Rules for 2026
Starting now, change the way you are analyzing creative. Looking at a per creative basis doesn’t tell the full story.
1. Analyze at the Topic Level, Not the Ad Level
Under Andromeda, creative doesn’t perform in isolation — it performs as a theme inside a 25+ creative portfolio.
Topics = creative themes (testimonials, demos, founder’s story, comparison, UGC). I’ve covered these before, and they’re now more important than ever.
Instead of asking “Which ad has the best CPA?”, ask:
- Which topic drives the most efficient traffic?
- Which topic drives the strongest mid-funnel intent?
- Which topic ultimately feeds your highest-converting ads?
The topic is the “signal.”
The individual creative is the “variation.”
Analyze in that order.
If you want to isolate and validate these themes before deploying them into a blended campaign, I break down the two-layer creative testing model here.
2. Set Up Micro-Conversions to Expose Intent
Every advertiser should be feeding Meta more signals – not just final conversions.
- E-commerce: View Content, Add to Cart, Begin Checkout
- Lead gen: Button clicks, form starts, long session durations, multi-page visits
These tell you:
- What audiences your upper-funnel creatives are attracting
- Which themes produce the most consideration
- Where users stall in the journey
This not only improves creative insight – it improves website UX analysis.
3. Refresh Creative Frequently (Every 2–4 Weeks)
You don’t need a new concept every two weeks – you need iterations every two weeks.
Meta’s GEM model thrives when you feed it variations of what’s already working.
Cadence by advertiser size:
- Large budgets: 2–3 new pieces per week
- Mid-sized: 2–3 new pieces every 2 weeks
- Small budgets: 2–3 new pieces every 4 weeks
This steady flow protects against fatigue, improves match rates, and widens the algorithm’s ability to deliver the right creative to the right user journey stage.
Creative Analysis in the Andromeda Era
Andromeda is changing everything about how creative works in Meta. In 2026, the winners won’t be the advertisers with the most ads, but rather those with the most diverse set of messages.
Understanding the user journey is becoming imperative as marketers need to build a system where each creative plays a specific role:
- Upper-funnel ads earn attention
- Mid-funnel ads build intent
- Bottom-funnel ads close demand
The advertisers who adapt to this model will see more stable performance and efficient spend distribution. The one’s who don’t will continue to misread CPLs and pause the wrong ads while fighting the system.
If you want help putting this system into practice, I built a creative analysis dashboard that does the heavy lifting for you.
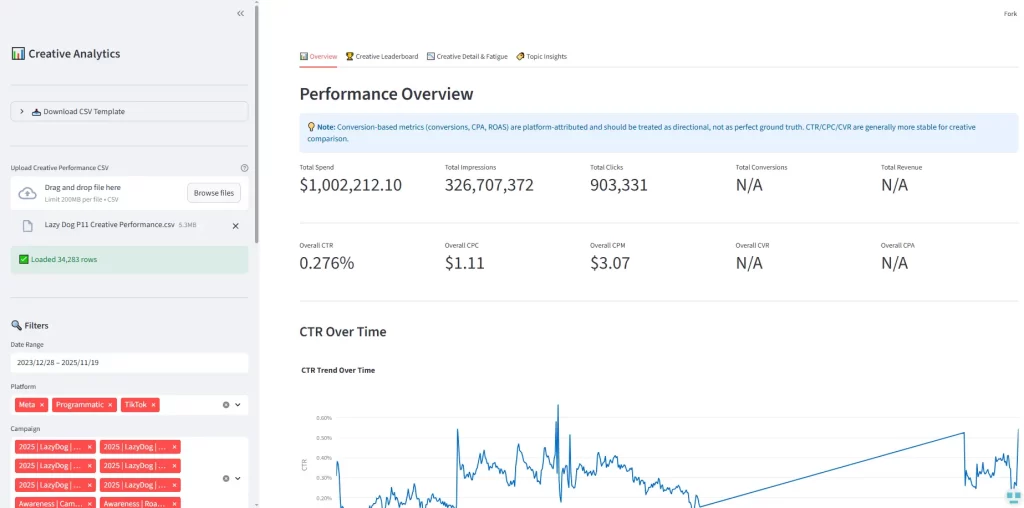
- Upload your creative performance data
- It automatically categorizes your ads by KPI
- Use it to identify the true drivers of performance
Andromeda rewards advertisers who understand their creative portfolio. This dashboard helps you become one of them.