

How I Structure Weekly Marketing Performance Reporting
Weekly reporting is one of the most important functions in a successful marketing organization, and one of the most misunderstood.
Most weekly reports miss the point. They focus on as many KPIs as possible, examine none of them deeply, and end up restating the same information week after week: numbers went up, numbers went down.
Because reports are often due by end of day Monday or Tuesday, they’re rushed and reactive. They summarize what already happened instead of helping teams decide what should happen next.
That’s a problem. Weekly reports aren’t meant to explain performance in full. They’re meant to provide direction for the next set of decisions: should the strategy change, or is it doing what we intended?
Weekly trends – when viewed alongside changes in spend – are how you answer that question. Reports that rely on static metrics or ignore spend fluctuations mostly describe seasonality and market noise.
In this article, I’ll walk through how I structure weekly marketing performance reports to understand whether a strategy is working and when change is actually needed.
TL;DR
- Weekly reports should guide decisions, not summarize KPIs.
- Spend is the primary leading indicator – it signals intent before results appear.
- Conversions and CPA are lagging indicators and must be read in context.
- Diagnostic metrics like CTR create noise and belong outside weekly reports.
- The goal of weekly reporting is to understand direction, not overreact to short-term fluctuation.
What A Weekly Report Is Not
Before getting into what good weekly reporting looks like, it’s worth calling out what bad weekly reporting usually looks like.
Last week, Search spent $4.2K (+15% WoW), drove 1K clicks (+10% WoW) at a $4.20 CPC (+5% WoW), and generated 20 sign-ups (+5% WoW) at a $210 CPA (+10% WoW).
This sentence contains a lot of numbers. And almost no context. It leads to more questions.
Is a $210 CPA good?
Why did spend increase 15% week over week?
What happened to the other 980 clicks?
Most weekly reports fail in three predictable ways:
- They’re KPI dumps
- They show up/down movement without context
- They’re siloed by channel instead of system-level
A weekly report shouldn’t be a performance scorecard. It should explain what changed, what that change is doing to the system, and why it matters.
Leading, Lagging and Diagnostic Metrics
To make weekly reporting useful, it helps to clarify the different roles metrics play. Not all metrics serve the same purpose, and mixing them together creates noise.
I group metrics into three categories: leading, lagging, and diagnostic.
Leading Indicators
Leading indicators represent inputs to the system. The decisions that change performance.
The most important leading indicator in weekly reporting is spend. Spend determines where marketing effort is applied and what priorities the strategy is signaling.
Other metrics like impressions or clicks can sometimes act as leading indicators, but they’re far harder to compare across channels and are better used diagnostically.
Leading indicators don’t predict success. They establish expectations.
Lagging Indicators
Lagging indicators measure outcomes. These are typically conversions, revenue, or cost per acquisition.
They’re called lagging because results take time. People don’t convert the moment spend changes – they evaluate, compare, and decide.
Weekly reporting only works when lagging metrics are read after leading ones, not alongside them.
Diagnostic Metrics
Diagnostic metrics explain why performance looks the way it does.
Metrics like CTR, CPC, engagement rate, or frequency help diagnose creative, traffic quality, or site behavior – but they rarely change weekly decisions.
These metrics are useful during investigation, not in weekly summaries. Including them in reports often introduces more noise than clarity.
I’ve done guides on diagnostic metrics for YouTube, Meta, and TikTok. If you’re interested, check them out.
The One Question a Weekly Report Should Answer
Weekly reports should answer a single question:
What are we changing and why?
Diagnostic metrics are important, but they belong outside the weekly report. They’re tools for the media buyer, not decision drivers for the week ahead.
Weekly reporting works best when it stays focused on system inputs and outcomes:
- Leading indicator: Spend
- Lagging indicator: Cost per acquisition (or revenue)
Everything else supports interpretation, not direction.
Spend Is the Leading Indicator
On a weekly basis, spend is the primary lever that changes performance.
Where are we allocating budget? Across which channels, products, or locations? And does that allocation reflect current priorities?
Spend signals intent. It shows what the strategy is focused on before results appear.
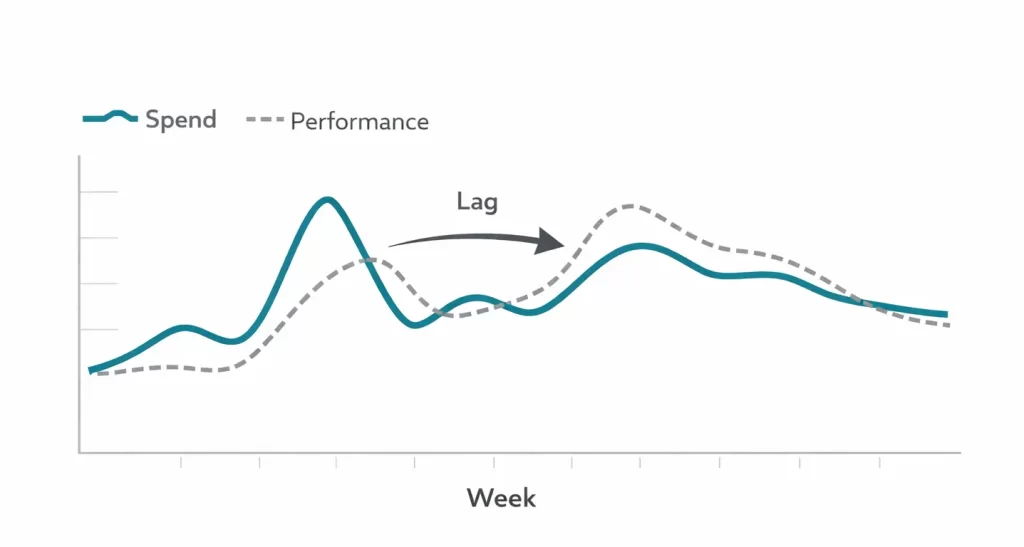
Weekly reporting should make spend changes explicit and show how those changes affect downstream outcomes like conversions or sales.
CPA Is the Lagging Indicator
Once spend is clearly mapped week over week, CPA shows the result of those decisions.
CPA shows efficiency, but also constraint. If it stays within acceptable bounds, the business remains profitable (all the more reason to know your numbers and set goals).
Weekly reporting should make it easy to see whether CPA is holding, deteriorating, or stabilizing as spend changes. Deeper analysis can come later. The weekly goal is to understand direction, not diagnose every driver.
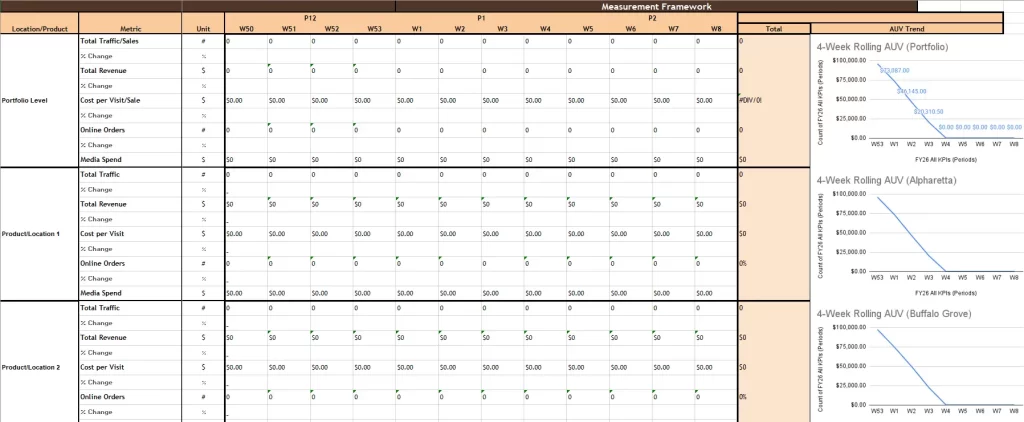
The Core Structure of My Weekly Marketing Report
At its core, my weekly marketing report is a simple spreadsheet. No dashboard or slide deck.
One common mistake is only comparing the last two weeks. That makes it hard to understand where the system has been.
Instead, the spreadsheet should include the full year, broken out by week. This makes strategy changes and inflection points visible over time.
Why I Use Trends and Rolling Averages
The spreadsheet starts with core metrics only. These vary based on business type, but generally include:
- In-Store Traffic/Sales
- Revenue
- Online Sales
- Cost per Sale
- Media Spend
These are mapped out by week to create a trend chart.
Raw weekly data is often noisy. To make trends easier to read, I use simple rolling averages.
Rolling average = (Week 1 + Week 2 + Week 3 + Week 4) / 4
A four-week rolling average smooths natural volatility and helps correct for conversion lag by incorporating prior weeks of performance.
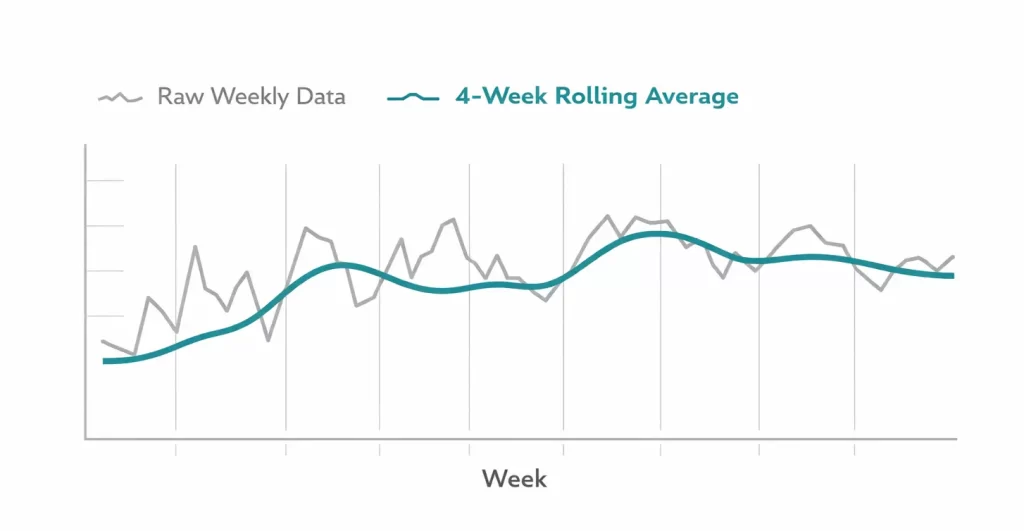
The goal is clarity, and confidence in the metrics.
Additional Factors For Analysis
As reporting matures, additional dimensions can add insight: new vs returning customers, recurring vs one-time revenue, or subscription enrollments
These factors help explain why performance is changing and where marginal returns are coming from. They should be layered in separately, and only when there’s a business objective aligned with them.
Similar to how forecasting ad performance dictates channel budget allocation, what business objectives contribute to the bottom line is crucial to focus marketing efforts.
How I Read Performance Without Overreacting
Weekly decisions should never be made from a single data point.
I start with a portfolio-level view using rolling averages. If performance trends downward over multiple weeks, then a change is introduced and monitored.
One-week dips rarely justify action. Trends do.
What I Leave Out of Weekly Reports
I intentionally leave out granular execution details – creative performance, channel tactics, campaign settings.
Those analyses matter, but they’re better suited for bi-weekly or monthly reviews where more data builds confidence in the assumptions being drawn.
Creating Better Tests
Testing directly relates to learning. Having one or two tests in progress makes weekly reporting that much more valuable.
Pick one variable in your marketing strategy to test that week, add spend, and analyze the effect on lagging indicators over the next week or two.
Only change one or two variables at a time to limit the cross pollution of results. Since performance is analyzed at a high-level, too many changes will make it hard to determine what ultimately caused the effect.
How Weekly Reports Feed Better Decisions
Weekly reports are the engine for learning. They connect strategic decisions to business outcomes over time.
Scaling or pausing spend has a delayed impact. Reporting that accounts for that delay reduces uncertainty and prevents reactive decisions.
The goal isn’t cause and effect, but informed confidence.
Weekly Reports Are Inputs, Not Verdicts
A good weekly report doesn’t deliver final answers. It creates alignment around what to investigate next.
Testing is at the core of marketing, and weekly reports validate those tests.
In the next article, I’ll look at how to automate this process — reducing effort while preserving insight.
A solid reporting framework comes first. Automation only works when structure is sound.
Get a downloadable version of the template I shared in the resource hub