
Building A Monthly Marketing Report That Drives Strategy
Marketing measurement is an ever-moving target. Different stakeholders need different levels of analysis, context, and granularity. A one-size-fits-all report rarely works, but a strong reporting process should still connect each layer of performance into a clear view of what matters.
In the end, a good marketing report is meant to influence decision-making. On a monthly timeframe, those decisions can be the difference between incremental improvement and stagnation.
I’ve already laid out a framework for weekly marketing reporting, where the focus is on monitoring short-term trends, diagnosing performance changes, and identifying immediate optimizations. Monthly reports follow a similar logic, but they zoom out. Instead of asking what changed this week, they ask what changed enough to influence strategy.
Monthly reports are where results are turned into action. Insights are only as valuable as the decisions they create, and monthly timeframes are usually the minimum window needed to evaluate larger changes across budget, channel mix, creative direction, landing pages, and measurement quality.
This article will look at how I structure monthly marketing reports that speak to different levels of seniority, while still creating a standardized process that can work across industries.
A lot of this process depends on understanding which sources of truth should inform marketing decisions. For more on that, read Making Confident Marketing Decisions With Incomplete Data.
TL;DR
Monthly reports should do more than recap performance. A strong report connects business outcomes, campaign performance, creative learnings, and strategic recommendations into one clear story: what happened, why it happened, and what should change next.
Good Monthly Reports Start With Business Objectives
All marketing campaigns ladder up to business goals. For that throughline to exist, reporting needs to show how business performance changes over time.
I’ve discussed what business goals are most common in marketing campaigns. Read more in Setting Marketing Goals.
For an executive-level monthly report, the first section should focus on top-line business metrics like Sales & Revenue. These are not always metrics marketing fully controls, but they are the outcomes marketing should be connected to.
Breaking Goals Into Marketing Workstreams
The next step is looking at business metrics through a marketing campaign lens.
What marketing activities were executed, and how did business performance change in the areas those activities were meant to influence?
This could be a paid marketing campaign that runs nationally, or regionally against store locations. Breaking out business metrics into more granular buckets helps tease out the impact of marketing campaigns and seasonal fluctuation.
For example, analysis can occur at different levels of detail:
- Store locations
- Products
- Limited time offers/promotions
- Business lines (online, offline, 3rd party)
Each level reveals a different perspective on what happened. Aligning these with marketing efforts is a powerful way to show real world impact.
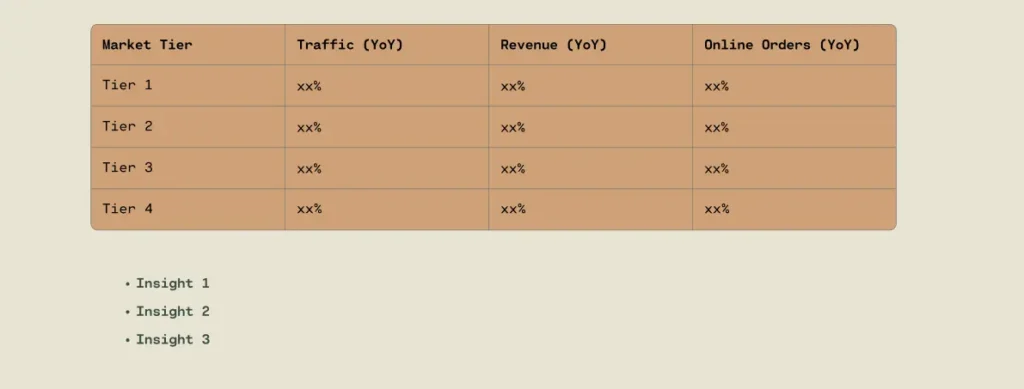
For example, a monthly report may include a table showing year-over-year traffic, revenue, and online orders by market tier. This type of view helps stakeholders understand whether the markets receiving heavier marketing support are also seeing stronger business movement.
Real World Example
In a marketing strategy I’ve put together, different regions were broken out into market tiers based on priority. Each tier receives a different level of marketing support (channels, budget).
Each month, performance was analyzed by market tier to understand whether higher priority (higher spend) regions were seeing a greater lift in year over year performance.
Comparing tiers against each other provided valuable context. The analysis did not just show whether the business was up or down overall. It showed how performance differed based on the level of marketing support each region received.
This is where monthly reporting becomes more useful than a simple KPI recap. It connects business outcomes to the actual structure of the marketing plan.
Once business metrics are addressed, the next lens of analysis is platform-specific campaign data.
Campaign data informs strategy on the platform-level
Campaign data shifts the analysis away from backend business reporting and into channel-level performance. This is where ad attributed results take centerstage.
The value of campaign data is not just that it shows conversions. It shows how different channels, tactics, and campaign structures contributed to those outcomes.
While campaign goals run the gamut of digital metrics from views to engagements to conversions, the most important marketing metrics to analyze are those that contributed most closely to business impact.
For the purpose of this discussion, that usually means actions like:
- Leads
- Purchases
- Offline actions like store visits
These metrics are inherently biased thanks to platfrom attribution, but are still the clearest signal of how campaign performance is influencing the bottom line.
How Marketing Goals Are The Signal for Success
Marketing goals tie directly back to the campaign objective. In monthly reporting, campaign performance is usually analyzed at two levels:
- Always-on campaigns
- Test campaigns
This distinction is important because each type of analysis serves a different purpose.
Section 1: Always-On Campaigns
Always-on campaigns are typically measured purely on an efficiency basis.
- How much did it cost of drive a lead or purchase
- Is Google cheaper than Meta, or vice versa
- Are optimizations improving efficiency
These questions are answered with both a tactic-level and cross-channel view.
A monthly report does not need to overcomplicate this section. A slide showing always-on conversion performance over time is usually enough to show whether campaign improvements are actually moving performance in the right direction.
Section 2: Test Campaigns
All good marketing strategies have tests running consistently. Documenting the results of these tests is crucial for continued learning.
Monthly reports need a slide per meaningful test that showcases information like:
- Test Details
- Objective
- Results/Outcomes
- Next Steps
This helps track against the learning goal of the campaign in a way that is easy to communicate to executive stakeholders.
A campaign test summary slide that shows metrics like spend, attributed revenue, ROAS, and click-through ROAS is an effective way to create a quick comparison between tests.
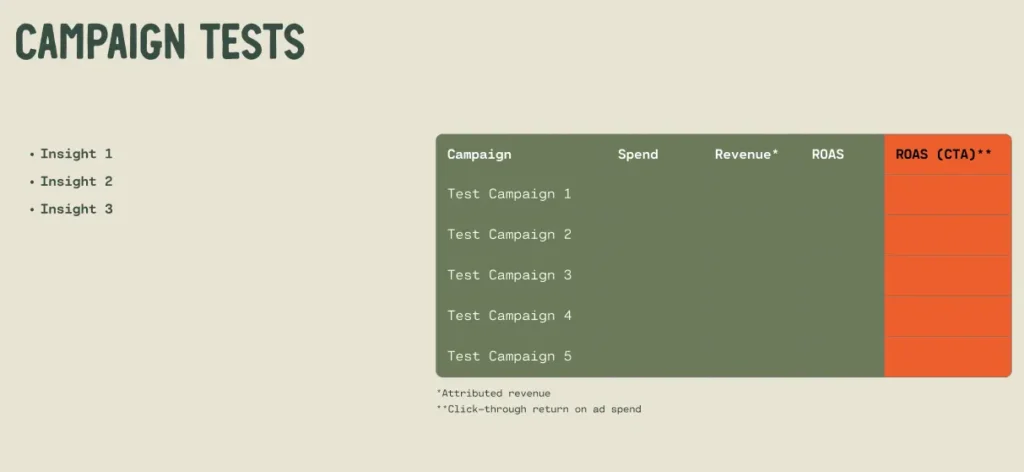
The goal is not just to report whether a test “worked.” The goal is to show what worked best, what was learned, and what to do next.
Creative performance is the next layer of analysis because it helps explain why the campaign performed the way it did.
Creative Analysis Explains the Why Behind Performance
Campaigns live or die by creative. This is especially true as campaigns become more algorithmically optimized and platforms rely more heavily on creative signals to determine who sees an ad.
Monthly analysis of creative is non-negotiable. It identifies messaging angles, content types, and formats that work well, and those that are not worth creating.
Analyzing Creative Dimensions
Creative analysis works best when assets are grouped into buckets. Individual assets are often too messy to analyze in isolation. Topics, formats, roles, and messaging angles create clearer patterns.
Review ad topic groupings in creative fatigue and why advertisers misunderstand it.
Instead of only comparing Ad 1 against Ad 2, a monthly report should look for patterns across categories like:
- Campaign objective
- Content type
- Content role
- Ad format
- Messaging angle
A single ad may perform well for several reasons. But if multiple videos with the same messaging angle outperform multiple carousels with a product-first message, that is a much more useful insight for the creative team.
Metrics That Matter in Creative Reporting
Creative reporting should use as few metrics as possible. Most reports include clicks, conversions, CTR, engagement, CPC, CPM, spend, and more, but too many metrics can make the story harder to understand.
For monthly creative analysis, the most useful metrics are usually:
- Cost per conversion
- Hook rate (read how to calculate hook rate)
- Engagement Quality Score
- Spend
Each metric tells a different story.
- CPA: How effective was it at driving action
- Hook rate: How effective was it at capturing attention
- Engagement Quality Score: How strongly users interacted
- Spend: How effective was it overall
Metrics like click-through rate and cost per click can be used as diagnostic metrics, but can’t communicate entirely why a creative performed well or not.
Creative Reporting Examples
Creative performance can be summarized in a few different ways.
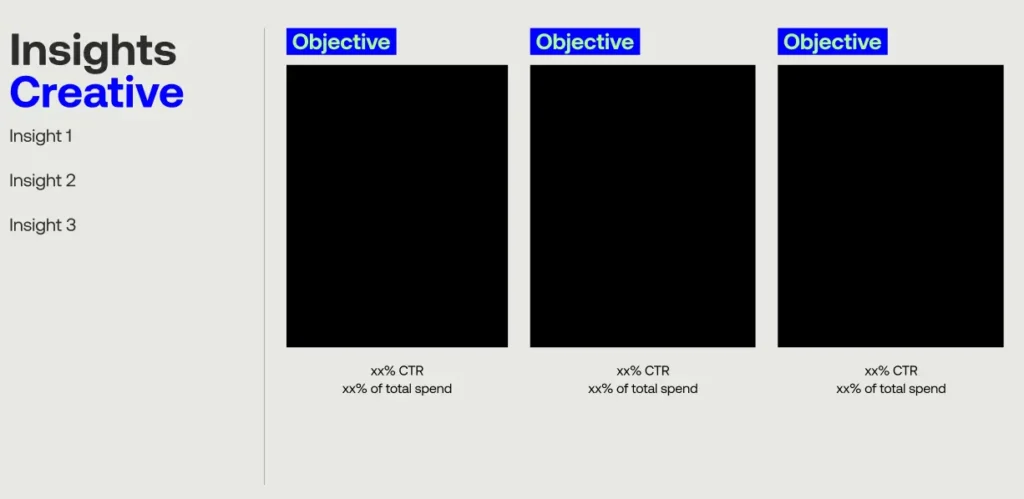
One format is to show top-performing creative examples alongside the objective, CTR, and share of spend. This works well when the goal is to show which individual assets or content types earned attention and delivery.
Another format is to summarize creative topics by spend distribution. This works well when the goal is to understand where the platform is concentrating delivery across different creative themes.
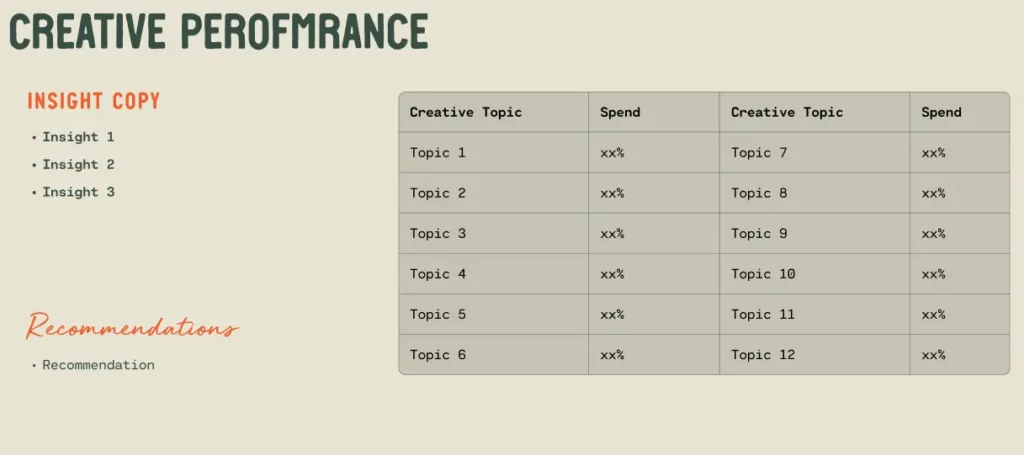
The key is not to overload the slide. Creative reporting should make it easy to see what worked, why it mattered, and what should be produced next.
Real World Example
In a recent client case, we launched new campaigns weekly across different business lines and marketing objectives, but the creative approach stayed relatively consistent.
Most ads were product-focused and built primarily in carousel formats. After several months of reporting, a pattern started to emerge: video was consistently dominating performance.
This led us to rethink the strategy. Instead of using valuable creative resources to build more carousels, we started repurposing existing organic social videos into paid media assets. The payoff was immediate.
Conversion performance improved, the creative team had more time to work on other projects, and we spun our wheels less on new campaigns.
Monthly reports build the path forward
All the analysis of business goals, campaign performance, and creative has one purpose: informing future strategy. A monthly report needs to communicate this path forward every time.
This builds trust with key stakeholders and aligns teams on future tests, expectations, and priorities.
It also gives everyone an opportunity to add perspective. That input is valuable because marketing performance is rarely driven by one variable. Media, creative, audience, offer, landing page, sales process, and business context all influence results.
Structuring Strategic Recommendations
Similar to campaign performance reporting, strategic recommendations should be bucketed into categories.
At a high level, recommendations usually fall into three categories:
- Campaign tests
- Creative tests
- Strategic changes
Recommendations typically serve one of two purposes: reacting to a performance issue or proactively testing a new opportunity.
Campaign and Creative Tests
Campaign tests focus on how media is being delivered. These tests may include changes to campaign structure, budget allocation, flighting, audience segmentation, optimization events, or channel mix.
Creative tests focus on what message is being delivered. These tests usually include changes to content type, messaging angle, offer, hook, format, or call-to-action.
Following a creative brief is necessary here. For more on that process, read how to create a creative brief and download a template from the Resource Hub.
In both instances, a slide in the monthly report should define the objective, test details, timing, budget allocation, and expected learning.
Strategic Changes
Strategic changes play a larger role within the marketing strategy. Instead of focusing only on campaign objectives or creative messaging angles, strategic changes aim to answer bigger questions about the business.
These recommendations may involve external data sources, revised target audience profiles, new geographic priorities, product focus changes, offer adjustments, or shifts in channel investment.
Operational management is another area where monthly reports can create value. Some recommendations are not tied to a single campaign, but still improve the broader marketing system. Improving the reporting process, creative workflow, audience planning, or measurement setup effect multiple marketing functions – a win across teams!
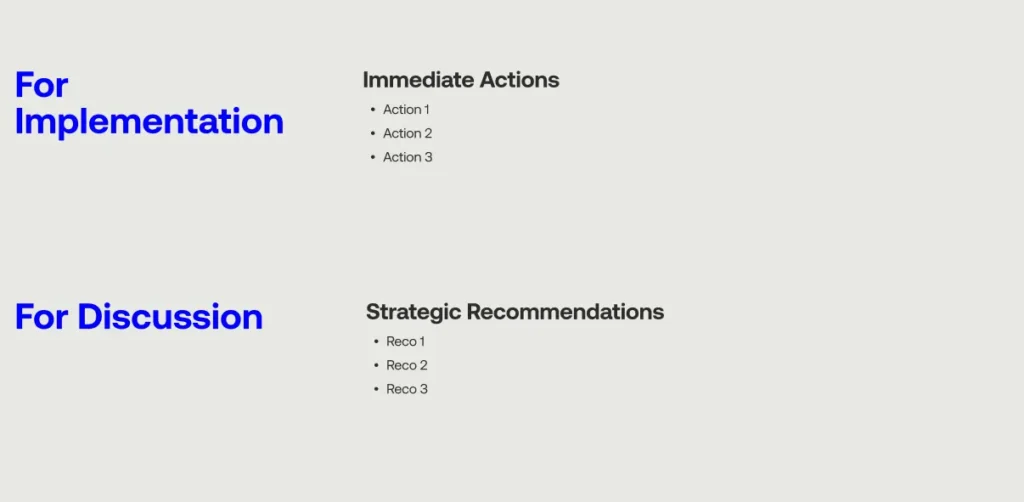
Recommendations for both live in a single consolidated slide, or as individual test slide breakouts. The level of granularity depends on the budget and extent of testing.
Examples
These two examples of path forward slides look at a consolidated structure and individual test breakout.
Test Breakout
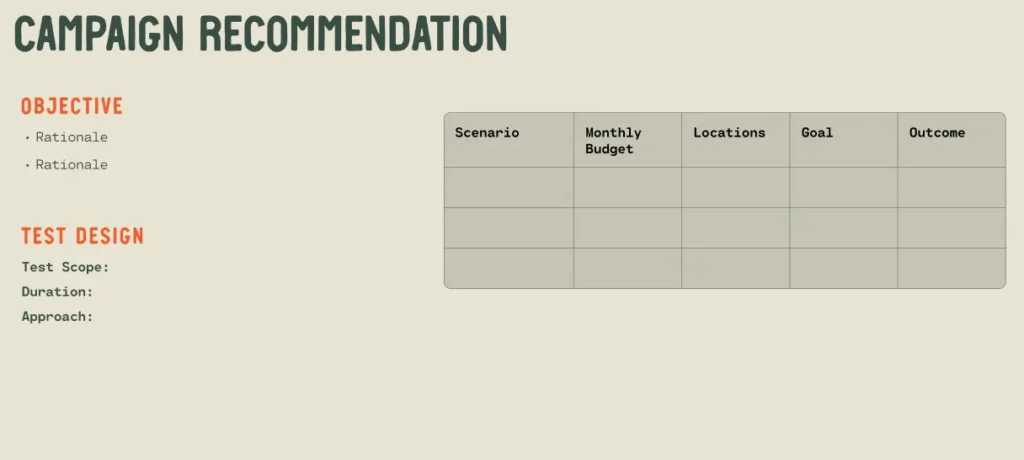
Consolidated Slide
Write the Executive Summary Last
Although the executive summary is arguably the most important slide in the entire report, writing it last makes it much easier to complete.
That’s because it sums up the key insights and findings from each section of analysis. Aim to include information from each section that answers the following questions:
- What happened?
- How did we quantify it?
- What does that mean moving forward?
The executive summary connects the facts to the path forward. It should present the most important evidence, explain why it matters, and make the next steps clear for stakeholders who may not review every detail slide.
There are a few ways to structure an executive summary, but two formats tend to work well.
Detailed Performance Summary
A detailed performance summary works best when the report needs to communicate results across multiple objectives, channels, or business units.
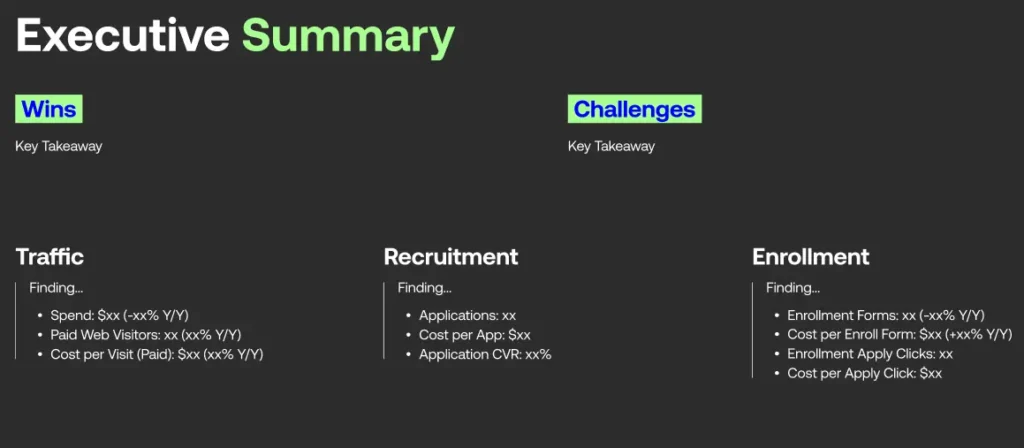
This format usually includes key wins, challenges, and performance indicators by section. It is useful when stakeholders need a broad view of what happened across the full marketing program.
Takeaway-Driven Summary
A takeaway-driven summary works best when the report needs to communicate the most important findings at a higher level.
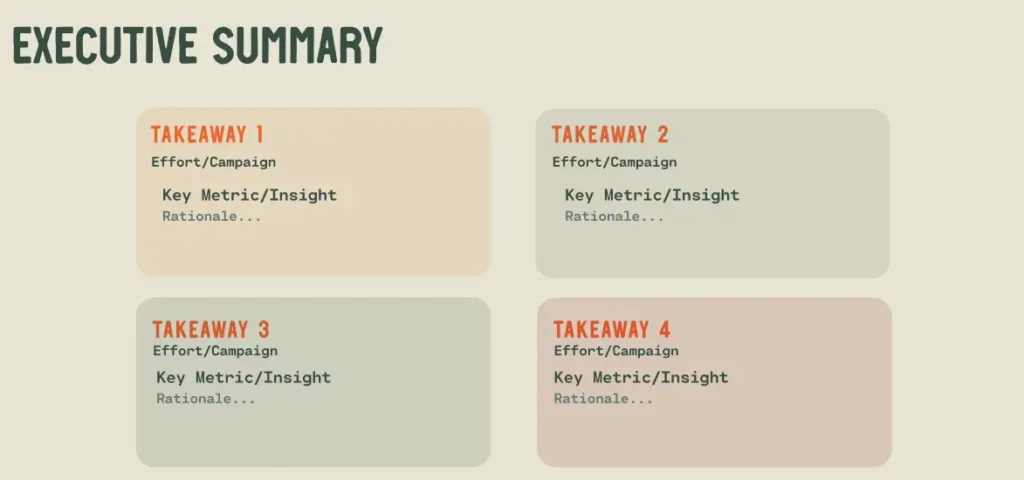
Instead of organizing the slide by channel or objective, this format organizes the story around key takeaways. Each takeaway should include the effort or campaign, the key metric or insight, and the rationale behind the recommendation.
Both formats serve the same purpose: pulling the most important findings from the detailed analysis and elevating them for an executive audience.
The right format depends on the complexity of the report. If there are several business objectives or stakeholder groups, a detailed performance summary may work better. If the goal is to align leadership around a small number of decisions, a takeaway-driven summary is stronger.
Monthly Reporting Turns Performance Into Strategy
The overarching goal of a monthly report is to turn reporting and data analysis into actionable next steps that can be communicated to both tactical teams and executive stakeholders.
A strong monthly report should connect business goals, campaign performance, creative learnings, and strategic recommendations into one clear narrative. The goal is not to include every possible metric. The goal is to explain what happened, why it happened, and what should change because of it.
That is what separates reporting from analysis.
Where weekly reports are useful for communicating near-term optimizations to tactical teams, monthly reports serve a different purpose. They give teams the opportunity to evaluate longer timeframes and align priorities around larger patterns.
The best monthly reports do not just summarize performance. They create alignment around what comes next.