
Apple Maps Ads: What an Early Pilot Revealed About Local Search Intent
Apple Maps Ads generated more than 11,000 direction requests during a recent pilot we ran for a multi-location restaurant advertiser. With approximately $9,900 in media spend, the early results were encouraging.
But as I started breaking down the performance, a more interesting story emerged.
One placement generated nearly 81% of impressions but fewer than 6% of direction requests. Automated targeting and text ads appeared remarkably efficient, but much of that performance came from search terms we couldn’t actually inspect.
The campaign was producing meaningful engagement signals. Understanding what was driving them, and whether they represented incremental business value, was considerably more complicated.
In this article, I’ll walk through what we learned from the pilot, including differences in placement efficiency, consumer search behavior, ad formats, and performance across 51 restaurant locations.
TL;DR
An early Apple Maps Ads pilot across 51 restaurant locations generated 11,377 direction requests on approximately $9,900 in media spend.
Search Results delivered 4.5 times as many direction requests per dollar as Search Home, an efficiency advantage that held across every location where both placements recorded direction requests.
However, 54.5% of Search Results direction requests came from obscured, low-volume search terms. Branded searches and differences in query mix also complicated the apparent efficiency of automated targeting and ad formats.
The results suggest Apple Maps Ads could become a useful component of local media strategies, but direction requests should be treated as indicators of potential visitation intent rather than verified store visits or incremental customers.
How Apple Maps Advertising Works
Apple announced Ads on Maps in March 2026 as part of its broader Apple Business launch, introducing two primary advertising placements.
Search Home allows businesses to appear within the Suggested Places experience before someone completes a specific search. Search Results places advertisers in front of consumers searching for a relevant business, category, or location.
The difference matters because these placements reach consumers at potentially different stages of their decision process.
Someone opening Apple Maps might be exploring what’s nearby without a particular destination in mind. Someone searching for restaurants has already expressed a more defined need.
We’ve encountered a similar distinction in our restaurant marketing work, where campaign timing and existing consumer demand influence how advertising translates into reservations. Apple Maps introduces another opportunity within that decision process: reaching consumers as they’re deciding where to go.
After tapping an Apple Maps ad, consumers enter the business’s place card, where they can request directions, browse photos, visit its website, call, or share the location.
Unlike conventional paid search, the interaction doesn’t necessarily continue to an advertiser’s website. The place card itself becomes part of the conversion experience.
That changes what advertisers can measure and, more importantly, how they should interpret performance.
Inside Our Apple Maps Ads Pilot
The pilot ran from August 27 through October 1, 2026, promoting a restaurant brand across 51 locations.
We used Search Home and Search Results placements, with Search Results delivery incorporating keyword targeting and Apple’s automated Search Match functionality.
The platform reported the following results:
| Metric | Pilot results |
|---|---|
| Media spend | $9,897 |
| Impressions | 6,042,639 |
| Ad taps | 113,891 |
| Tap-through rate | 1.88% |
| First actions | 35,144 |
| First action rate | 30.9% |
| Direction requests | 11,377 |
| Spend per direction request | $0.87 |
At approximately $0.09 per tap and $0.28 per first action, the platform appeared capable of generating substantial engagement at relatively low media costs.
But these metrics require some interpretation.
An ad tap indicates engagement with the placement. Apple’s first actions metric counts ad taps that resulted in at least one subsequent place-card action, which could range from viewing photos to requesting directions.
For a restaurant advertiser, I was particularly interested in direction requests as a stronger indicator of potential visitation intent.
That became the primary metric for evaluating efficiency throughout the pilot.
Search Results Generated Most of the Action, While Search Home Generated Most of the Reach
The largest performance difference emerged when we separated placements.
| Metric | Search Results | Search Home |
|---|---|---|
| Spend | $7,798 | $2,098 |
| Impressions | 1,155,318 | 4,887,321 |
| Taps | 104,259 | 9,632 |
| Tap-through rate | 9.02% | 0.20% |
| First action rate | 31.6% | 22.9% |
| Direction requests | 10,734 | 643 |
| Spend per direction request | $0.73 | $3.26 |
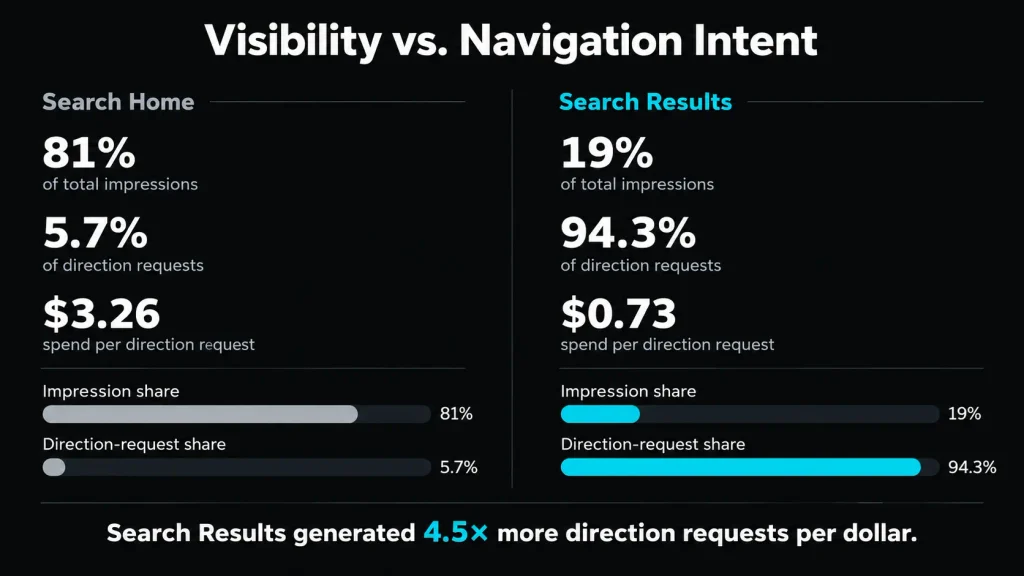
Search Home accounted for approximately 81% of campaign impressions on only 21% of spending.
If we evaluated the campaign primarily on visibility, Search Home would appear particularly attractive.
But Search Results generated 94% of direction requests.
On a spend-adjusted basis, Search Results produced approximately 4.5 times as many direction requests per dollar.
The result is consistent with what we’d expect from the underlying consumer behavior.
Search Results reaches users who have already expressed a specific need. Search Home reaches consumers at a potentially earlier stage, before they’ve necessarily decided what they’re looking for.
This creates a distinction between demand capture and discovery.
For a campaign focused on generating near-term navigation actions, Search Results appears to be the stronger placement. Search Home may still contribute value by introducing businesses earlier in the decision process, but its impact is harder to evaluate through direction requests alone.
A consumer might encounter a restaurant in Suggested Places and return to it later through an organic search. The pilot’s reporting wouldn’t establish that relationship.
The two placements therefore shouldn’t automatically share the same performance benchmark.
The Efficiency Difference Was Consistent Across Locations
One question I had when reviewing the aggregate results was whether a handful of particularly strong restaurants were responsible for the placement difference.
The location-level data helped answer that.
Of the 51 restaurants, 50 generated direction requests through both placements.
Search Results had a lower spend per direction request at all 50 locations. The remaining location generated Search Results directions but no Search Home direction requests.
That consistency strengthens the aggregate finding.
It doesn’t prove that Search Results will outperform Search Home in every campaign, but it suggests the observed difference wasn’t driven by a few unusually efficient markets.
Across this advertiser’s restaurant footprint, Search Results was consistently the more efficient source of navigational engagement.
More Than Half of Search Results Direction Requests Came From Obscured Search Terms
Placement performance was only part of the analysis.
When I added actual search-term reporting, another important pattern emerged.
Of the 10,734 direction requests generated through Search Results, 5,853 were attributed to Apple’s “(Low volume terms)” reporting bucket.
That’s 54.5% of direction requests, associated with just 37.4% of Search Results spending.
| Search-term reporting | Share of spend | Share of directions |
|---|---|---|
| Low-volume terms | 37.4% | 54.5% |
| Individually reported terms | 62.6% | 45.5% |
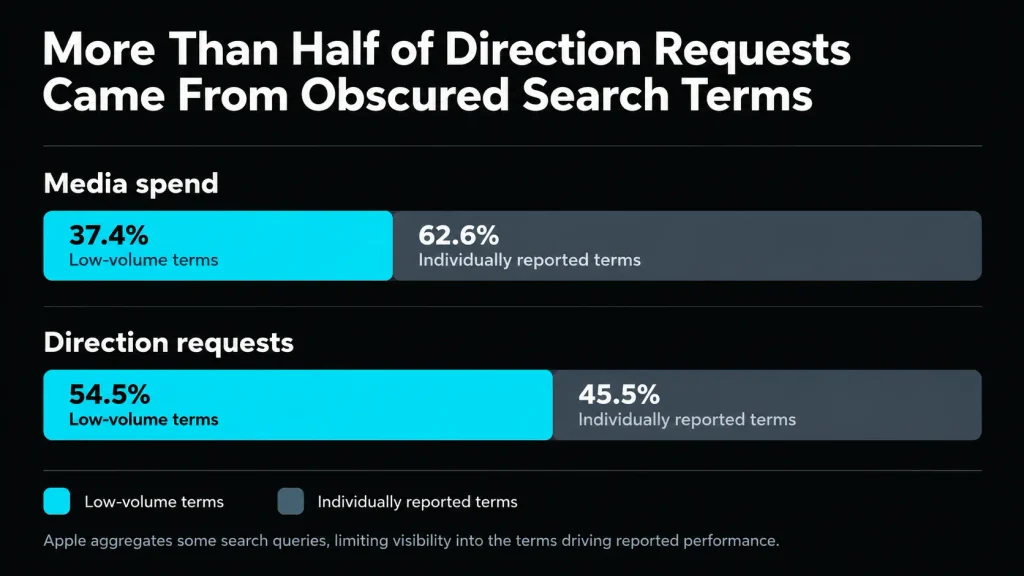
The aggregated low-volume bucket generated direction requests at approximately $0.50 each, considerably more efficiently than the remaining traffic.
This introduces a meaningful limitation for advertisers trying to optimize search targeting.
Apple’s reporting can aggregate lower-volume search queries for privacy reasons. Advertisers can observe the spending and resulting actions, but may not be able to inspect the individual searches responsible for that performance.
That makes it difficult to determine whether automated matching is identifying valuable new demand, capturing existing brand interest, or introducing searches that should be excluded.
We’ve explored a similar problem with Google Ads search-term reporting, where understanding actual consumer searches often provides more useful information than keyword-level performance alone.
Apple Maps presents its own version of that challenge, with a substantial portion of performance concentrated in queries we couldn’t individually evaluate.
Reported Queries Revealed Meaningful Differences in Intent
Among the search terms Apple did report individually, efficiency varied considerably.
| Actual search term | Direction requests | Spend per direction |
|---|---|---|
| Restaurants | 2,656 | $0.90 |
| Food | 803 | $1.36 |
| Fast food | 313 | $2.33 |
| Lunch | 185 | $0.91 |
| Dinner | 144 | $0.91 |
Broad restaurant searches generated considerably more direction requests than several other categories.
The difference between “restaurants” and “fast food” is particularly interesting.
Both might be relevant to a casual-dining advertiser, but they could reflect different consumer needs. Someone searching for fast food might prioritize speed, convenience, or price in ways that don’t align particularly well with the restaurant being promoted.
We can’t determine individual motivations from search-term reporting, but the differences reinforce why broad category relevance isn’t necessarily equivalent to strong customer intent.
It’s also important to distinguish between keyword targeting and actual search terms.
Apple allows advertisers to target business categories and search phrases, while Search Match can identify relevant searches automatically. The category or keyword receiving credit doesn’t necessarily describe the exact query that triggered an impression.
Branded Search Complicates the Picture
Two variations of the advertiser’s own brand name generated 452 direction requests at approximately $0.15 each.
That was substantially more efficient than the campaign average.
But someone searching directly for a restaurant by name may already know where they intend to go.
An ad appearing during that search might receive credit for a direction request even if the consumer would have navigated to the business organically.
Branded advertising can still have value, but attributed direction requests shouldn’t automatically be interpreted as newly acquired customers.
For local advertisers, separating existing brand demand from broader category searches is important when evaluating where advertising might create incremental value.
Search Match Looked Promising, but Its Efficiency Needs Context
Apple Maps Ads includes an automated targeting capability called Search Match, which uses business information and related categories to identify potentially relevant searches.
During our pilot, Search Match generated 4,621 direction requests on approximately $2,280 in media spend.
Within Search Results, that represented approximately 29% of spending and 43% of direction requests.
Its spend per direction request was approximately $0.49, compared with roughly $0.90 for the remaining keyword-targeted traffic.
On the surface, Search Match appeared to be a relatively efficient way to identify local demand.
But approximately 79% of its direction requests came from the aggregated low-volume search-term bucket.
It’s possible that automated matching was finding relevant searches we wouldn’t have identified manually. It’s also possible that the apparent efficiency reflected differences in query mix or existing brand demand that we couldn’t fully inspect.
The data doesn’t allow us to separate those explanations.
I’d treat Search Match as a potentially valuable discovery mechanism rather than immediately shifting more budget toward it based on aggregate efficiency.
The next step would be to evaluate visible search terms, identify irrelevant traffic, and compare automated matching against more deliberate keyword targeting.
Text Ads Were Surprisingly Efficient, but Format Wasn’t the Only Variable
Another notable result came from the ad-format breakdown.
Within Search Results, the campaign delivered ads using one-photo, three-photo, and text formats.
| Ad format | Spend per direction request |
|---|---|
| Text | $0.20 |
| One photo | $1.03 |
| Three photos | $1.49 |
Text ads generated 4,137 direction requests on approximately $811 in spending.
They accounted for about 10% of Search Results spend but nearly 39% of direction requests.
Initially, that seemed like a strong argument for prioritizing text ads over visually richer formats.
However, the search-term breakdown revealed that approximately 94% of direction requests attributed to text ads came from either obscured low-volume queries or searches containing the advertiser’s brand name.
We weren’t necessarily comparing creative formats across equivalent search conditions.
Text ads may have been disproportionately served in situations where consumers were already more likely to request directions, regardless of the ad format.
An ad can appear exceptionally efficient because of the audience, inventory, or search context associated with its delivery. That doesn’t establish that the creative itself caused the difference.
I’d want to understand whether the efficiency gap persists across comparable nonbranded search categories and individual restaurant locations before recommending a significant shift in format strategy.
For now, the text-ad performance is an interesting diagnostic finding, not a definitive creative optimization recommendation.
Multi-Location Performance Revealed Another Layer of Variation
Beyond placement and search behavior, efficiency varied substantially between restaurants.
For Search Results, spend per direction request ranged from approximately $0.29 at the most efficient location to $1.73 at the least efficient.
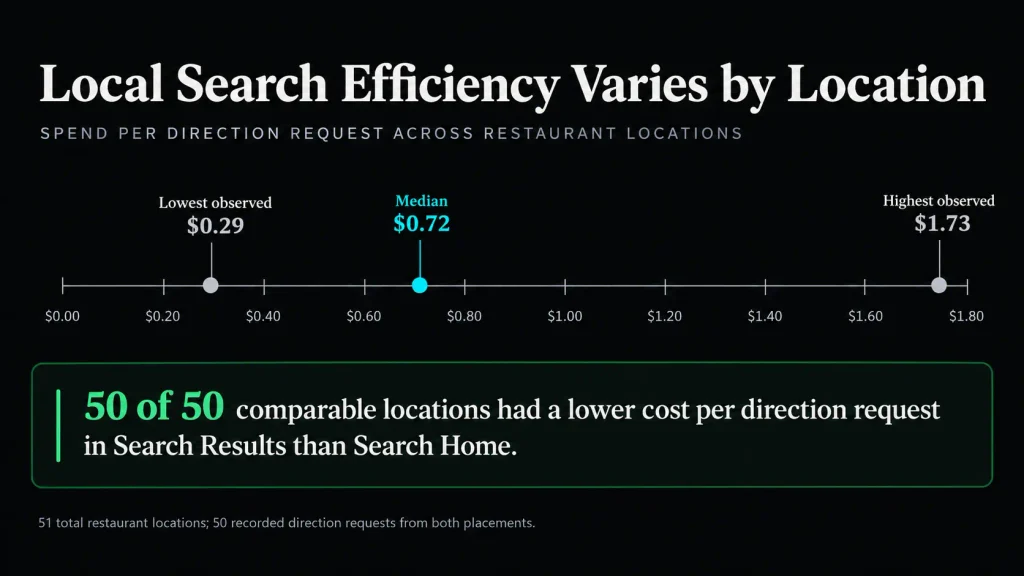
The median location generated direction requests at approximately $0.72 each.
That’s nearly a sixfold difference between the lowest and highest observed costs.
Some variation is expected. Restaurants operate in different markets, face different competition, and attract consumers with different search behavior.
But for a multi-location advertiser, a blended campaign metric can hide meaningful differences in local performance.
The challenge is determining which differences should influence investment.
We can’t assume the locations generating the cheapest direction requests are necessarily those where additional advertising would create the greatest business impact.
A high-performing restaurant might already attract substantial organic demand. Another location could have weaker existing traffic but more opportunity to grow its customer base.
I’d want to combine Apple Maps engagement with restaurant-level sales, reservations, historical traffic, and market demand before making geographic budget decisions.
It’s the same principle behind the Media Opportunity Index framework: campaign efficiency becomes more useful when evaluated alongside the actual commercial opportunity in each market.
Apple Maps provides another input into that decision, but shouldn’t become the sole determinant of investment.
Direction Requests Are Useful, but They Aren’t Store Visits
The most important measurement consideration is what Apple’s reported actions actually represent.
Across the pilot, the platform recorded 41,402 total place-card actions.
| Action | Volume | Share of actions |
|---|---|---|
| Photo views | 18,237 | 44.0% |
| Direction requests | 11,377 | 27.5% |
| Website actions | 9,128 | 22.0% |
| Shares | 1,860 | 4.5% |
| Calls | 800 | 1.9% |
Nearly half of all recorded actions were photo interactions.
For a restaurant advertiser, that may be entirely relevant behavior. Consumers often evaluate food, atmosphere, and the overall experience before deciding where to go.
But browsing photos isn’t equivalent to requesting directions, and a direction request isn’t evidence that someone actually visited the restaurant.
These actions represent different levels of potential intent.
Photo views and website interactions might indicate further consideration. Directions and calls provide stronger signals that someone could be moving toward a real-world interaction with the business.
Even then, we can’t establish that the consumer arrived, made a purchase, or wouldn’t have visited without the ad.
This is a familiar challenge in local media measurement. I’ve previously explored different approaches to measuring in-store visits and offline advertising impact, including the limitations of relying exclusively on digital engagement signals.
Apple Maps provides useful visibility into actions that happen within its environment. Those signals can support campaign optimization, but they shouldn’t automatically be assigned monetary values or treated as verified business outcomes.
For this pilot, I’d consider spend per direction request a useful operating metric, not a measure of return on advertising spend.
How I’d Approach the Next Apple Maps Ads Test
Based on these findings, the next phase should focus less on maximizing reported engagement and more on understanding which interactions represent valuable customer behavior.
I’d begin by prioritizing Search Results for near-term navigation objectives. The placement generated direction requests more efficiently across every restaurant where both placements produced directions. Search Home could still play a discovery role, but I’d evaluate that investment separately rather than holding it to the same action-based benchmark.
I’d also work toward separating branded, nonbranded, and automated search activity. The current results suggest meaningful differences in intent, but the large low-volume reporting bucket makes it difficult to understand exactly where Search Match and text ads are finding their apparent efficiency.
Finally, I’d connect location-level engagement to business performance.
For a multi-location brand, this could eventually involve a geographic experiment comparing restaurants or markets receiving Apple Maps investment against suitable controls.
With enough comparable locations and historical performance data, a matched-market design could help determine whether advertising contributes to changes in reservations, visits, or sales beyond what we’d otherwise expect.
We’ve previously explored this approach in a marketing incrementality case study.
It would represent a natural progression from evaluating reported direction requests to estimating the business value the advertising creates.
Is Apple Maps Advertising Worth Testing?
Based on this early pilot, I think Apple Maps Ads deserves consideration for businesses with physical locations.
The platform generated substantial engagement, and Search Results in particular produced navigational actions at a relatively low reported cost. That efficiency advantage was consistent across the advertiser’s restaurant footprint.
But the more interesting lesson is how much the interpretation changed once we examined the underlying data.
Search Match and text ads initially appeared exceptionally efficient. Search-term analysis revealed significant reporting limitations and differences in query mix that made those results harder to evaluate.
Direction requests also proved to be a useful indicator of potential visitation intent, but they couldn’t establish actual visits or incremental business outcomes.
As more advertisers adopt Apple Maps Ads, competition and delivery costs may change. These early results shouldn’t be assumed to represent long-term platform efficiency.
For now, the opportunity isn’t necessarily replacing existing local search investment. It’s understanding a new point of influence in the consumer decision process.
Apple Maps allows advertisers to reach consumers who may already be deciding where to go. The next challenge is determining how much of that engagement translates into business they wouldn’t have generated otherwise.
That’s where I’d focus the next phase of testing.
Methodology
This analysis uses two Apple Maps Ads reporting exports for an anonymized multi-location restaurant advertiser, covering August 27 through October 1, 2026.
The campaign included 51 restaurant locations, with performance analyzed by placement, ad format, keyword, actual search term, and location.
Both exports reconcile on impressions, taps, actions, and direction requests. A $1.05 difference in total spending reflects rounding across reporting granularities. Cost metrics were recalculated using summed counts and spending rather than averages of reported rates.
Spend per direction request represents media spend divided by reported direction requests, not the cost of a verified visit or acquired customer.
The results are observational. No randomized placement or creative experiment, matched-market lift study, or direct incremental sales measurement was conducted.
Platform documentation